Weight
Weight (clinical table).
| Name in the dataset | weight |
| Type | clinical |
| Stored in | clinical_data.csv |
| Unit | kg |
Measurement space
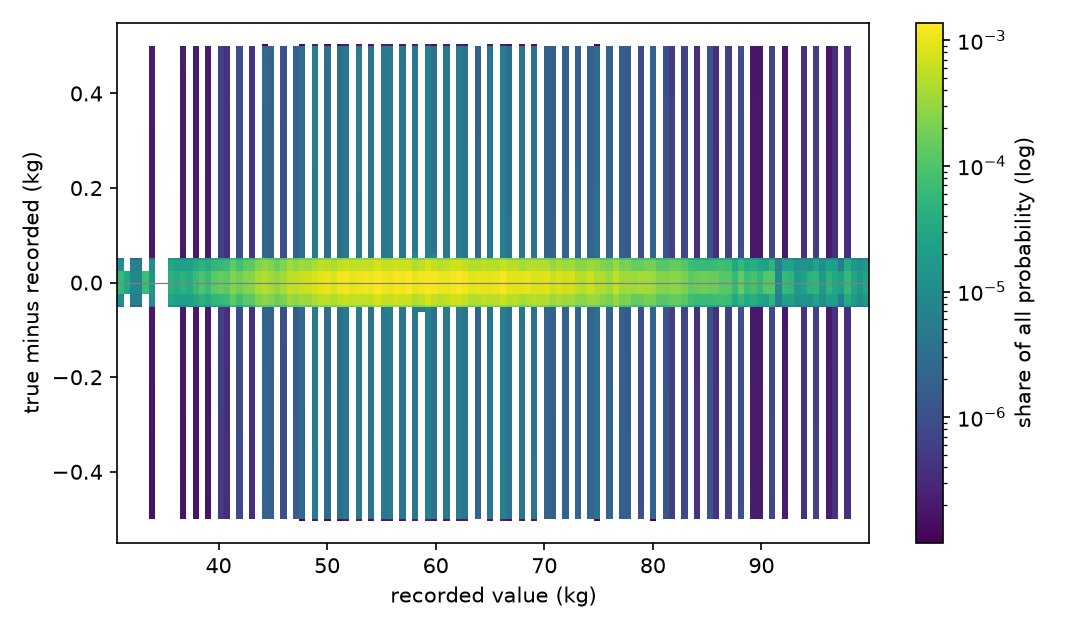
Vertical slices through the measurement space: how the true value is spread around a recorded one, for 2 recorded values chosen to show the different cases. Each panel has its own scale. Each is averaged over every record with that value in the release, from the pinned model; groups of fewer than 20 records are not shown.
- 59 kg (the commonest recorded value; 32 records): mean +2.44e-05 kg, SD 0.149 kg, 95% between -0.406 and +0.402. Rounding: scale_0.1 60%, whole_kg 26%, scale_0.05 14%.
- 53.4 kg (the narrowest; 31 records): mean +6.61e-05 kg, SD 0.0271 kg, 95% between -0.0493 and +0.0447. Rounding: scale_0.1 84%, scale_0.05 16%.
Time
This variable carries no time of its own in the dataset.
Value
| Model kind | model: fitted rounding model (value kind); posterior over the true value |
| Resolution | heaped: a mixture of rounding modes (see the value model) |
| Status | measured |
| Studies | Rounding and heaping of weight |
In this release
How wide the true-value distribution is, record by record, over 6,388 of 6,388 records (all clinical rows) that have one. Computed with the pinned model, aggregates only.
| Median | p10 to p90 | |
|---|---|---|
| Standard deviation | 0.0266 kg | 0.0144 to 0.147 kg |
| 95% interval width | 0.0937 kg | 0.0475 to 0.801 kg |
| Mean minus recorded | -6.96e-06 kg | -9.83e-05 to 0.000129 kg |
Value model
Model file: …/models/weight.model.json. Read from the pinned snapshot of vitaldb-resolution at commit bb03ddfc8a (2026-10-18).
How a true value becomes the recorded one. The rules are tried in order: a record not taken by an earlier rule is taken by this one with the probability shown (where its condition holds); the last rule takes the rest. Shares of all records depend on the conditions and the true value, so the model must be evaluated for them; the probabilities below are the fitted ones.
| Order | Rule | Rounds to | Probability if reached | Applies when |
|---|---|---|---|---|
| 1 | whole_kg | 1 kg (nearest) | 2.9 % | always |
| 2 | scale_0.1 | 0.1 kg (nearest) | 66.0 % | varies with department |
| 3 | scale_0.05 | 0.05 kg (nearest) | the rest | always |
| Recorded resolution | 0.05 |
| True-value density | log_student_t_regression |
| Covariates | sex, age, department |
| Fitted on | 6,041 records (clinical_data.csv) |
| BIC | 77,930 |
| Fitted | 2026-10-13 |
- Two scale resolutions are present (0.05 and 0.1 kg); modelled as modes rather than overridden.
- Measurement variability (beyond rounding): SD 0.5% of the value; for written-in values, SD 2.7 kg (from literature, not fitted).
Sources the model cites:
- Khosla T, Billewicz WZ. Measurement of change in body-weight. Br J Nutr. 1964;18(1):227-239. doi:10.1079/BJN19640022
- Vivanti A, Yu L, Palmer M, Dakin L, Sun J, Campbell K. Short-term body weight fluctuations in older well-hydrated hospitalised patients. J Hum Nutr Diet. 2013;26(5):429-435. doi:10.1111/jhn.12034
- Ko Y, Choi S, Won J, Lee YK, Kim DH, Lee SK. Differences in accuracy of height, weight, and body mass index between self-reported and measured using the 2018 Korea Community Health Survey data. Epidemiol Health. 2022;44:e2022024. doi:10.4178/epih.e2022024
Studies
| Study | Date | Status | Summary |
|---|---|---|---|
| Rounding and heaping of weight | 2026-10-13 | current | Recorded weight is a mixture of 3 rounding modes (whole_kg, scale_0.1, scale_0.05); the model gives the true value's distribution for each record. |
Worked examples
| Example | Side | Status | Summary |
|---|---|---|---|
| A regression that carries rounding uncertainty through | value | draft | Acute kidney injury after surgery against intraoperative urine output (mL/kg/h), fitted once on the recorded numbers and once per draw from the true-value distributions: the rounding moves 14% of cases across the oliguria threshold, but widens the confidence interval of the cohort's regression by at most 4%. |
| Charted propofol dose against the infusion pump | value | planned | The charted propofol bolus total against the volume the Orchestra pump records, as a check of the propofol heaping model and as a dose in mg/kg with its uncertainty. |
| Oliguria labels for a prediction model | value | draft | One label per patient, oliguric or not, from three rounded numbers: 10% of labels are uncertain and 2.6% are expected to be wrong, which sets a floor under the error any model can be measured to have. A typical model is barely affected; a good one is. |
| Urine output in mL/kg/h as a distribution | value | draft | Intraoperative urine output per kilogram per hour, from three rounded inputs, as a probability distribution per case: one case in ten cannot be placed confidently on either side of 0.5 mL/kg/h. |
Figures
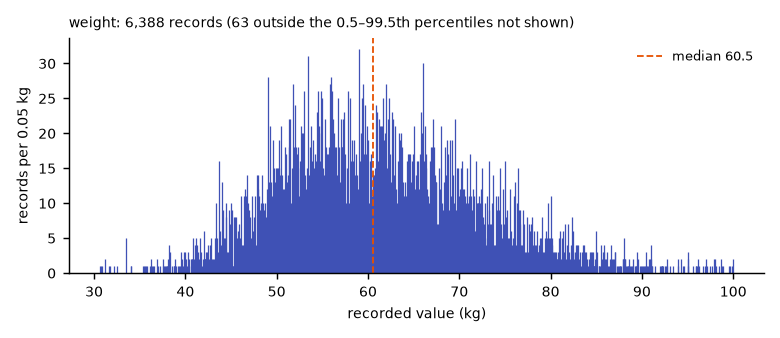
Tags: generated, vitaldb-resolution