Estimated blood loss
Estimated blood loss (clinical table).
| Name in the dataset | intraop_ebl |
| Type | clinical |
| Stored in | clinical_data.csv |
| Unit | mL |
Measurement space
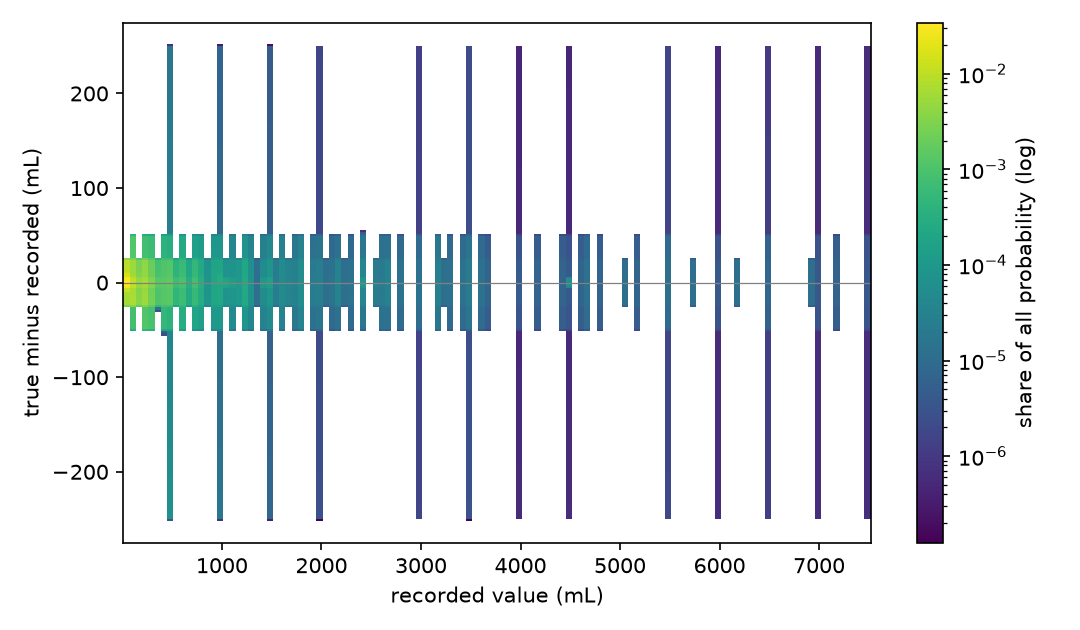
Vertical slices through the measurement space: how the true value is spread around a recorded one, for 4 recorded values chosen to show the different cases. Each panel has its own scale. Each is averaged over every record with that value in the release, from the pinned model; groups of fewer than 20 records are not shown.
- 50 mL (the commonest recorded value; 795 records): mean +1.67 mL, SD 13.3 mL, 95% between -24.2 and +22.6. Rounding: 50 mL 60%, preferred small values 38%, 10 mL (base) 2%.
- 1000 mL (the widest; 31 records): mean -12.4 mL, SD 82.3 mL, 95% between -224 and +185. Rounding: 100 mL 47%, 500 mL 30%, 50 mL 22%.
- 20 mL (the narrowest; 148 records): mean +0.212 mL, SD 2.98 mL, 95% between -6.44 and +4.23. Rounding: 10 mL (base) 58%, preferred small values 42%.
- 70 mL (unlike the others; 23 records): mean -0.0556 mL, SD 2.99 mL, 95% between -6.49 and +4.19. Rounding: 10 mL (base) 100%.
Time
This variable carries no time of its own in the dataset.
Value
| Model kind | model: fitted rounding model (value kind); posterior over the true value |
| Resolution | heaped: a mixture of rounding modes (see the value model) |
| Anchor | nearest (tested) |
| Status | measured |
| Studies | Rounding and heaping of estimated blood loss |
In this release
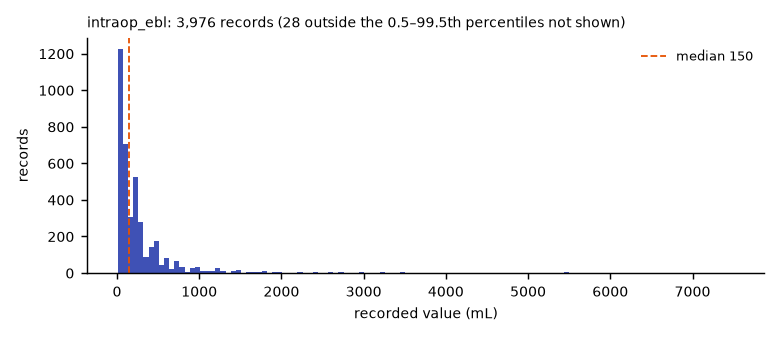
How wide the true-value distribution is, record by record, over 3,976 of 6,388 records (all clinical rows) that have one. Computed with the pinned model, aggregates only.
| Median | p10 to p90 | |
|---|---|---|
| Standard deviation | 14.3 mL | 2.89 to 24.5 mL |
| 95% interval width | 47.4 mL | 9.81 to 92 mL |
| Mean minus recorded | -0.984 mL | -3.83 to 3.02 mL |
Anchor
Nearest rounding preferred to floor (H1, last graduation passed) by BIC: 52 with the duration covariate, 25 without (same 3882 records; results/2026-10-18_refits_duration_zero.md). See what an anchor is and every variable's anchor.
Value model
Model file: …/models/intraop_ebl.model.json. Read from the pinned snapshot of vitaldb-resolution at commit bb03ddfc8a (2026-10-18).
How a true value becomes the recorded one. The rules are tried in order: a record not taken by an earlier rule is taken by this one with the probability shown (where its condition holds); the last rule takes the rest. Shares of all records depend on the conditions and the true value, so the model must be evaluated for them; the probabilities below are the fitted ones.
| Order | Rule | Rounds to | Probability if reached | Applies when |
|---|---|---|---|---|
| 1 | preferred small values | nearest | 42.1 % | true value below 75 |
| 2 | 500 mL | 500 mL (nearest) | 1.9 % | varies with the value (shown at 150) |
| 3 | 100 mL | 100 mL (nearest) | 23.8 % | varies with the value (shown at 150) |
| 4 | 50 mL | 50 mL (nearest) | 87.7 % | varies with the value (shown at 150) |
| 5 | 10 mL (base) | 10 mL (nearest) | the rest | always |
| Recorded resolution | 1 (modelled at 10) |
| True-value density | log_spline |
| Fitted on | 3,882 records (VitalDB clinical_data.csv (intraop_ebl), positive values on the 10 mL grid with a usable anaesthesia duration) |
| BIC | 22,390 |
| Fitted | 2026-10-18 |
- Only 0.7% of values are odd multiples of 5 and 17 are off any 5 mL grid; working resolution 10 mL.
Studies
| Study | Date | Status | Summary |
|---|---|---|---|
| Rounding and heaping of estimated blood loss | 2026-10-18 | current | Recorded estimated blood loss is a mixture of 5 rounding modes (preferred small values, 500 mL, 100 mL, 50 mL, 10 mL (base)); the model gives the true value's distribution for each record. |
Worked examples
| Example | Side | Status | Summary |
|---|---|---|---|
| Intraoperative fluid balance as a distribution | value | draft | Fluids in minus fluids out, each a heaped charted volume, as a distribution per case: the recording alone makes a balance uncertain by about ±60 mL, and by ±190 mL when the blood loss was written as a round 500 mL. |
Figures
Tags: generated, vitaldb-resolution