Skip to content

SpO₂ and pulse rate latency from step events

SpO₂ cannot be recomputed from one plethysmogram, so its timing comes from events that change the PLETH abruptly. SpO₂ lags the recorded PLETH by about 4 s and then smooths over roughly 10–20 s.

Date 2026-10-12
Status current
Methods Delays and averaging windows
Techniques Null controls
Devices Solar8000 monitor
Variables SpO₂, Solar8000 pulse rate (PLETH_HR), Plethysmogram (SNUADC)

Data

231 cases. Times are relative to the recorded PLETH, itself about 0.4 s behind the finger.

Results

Event Events Result
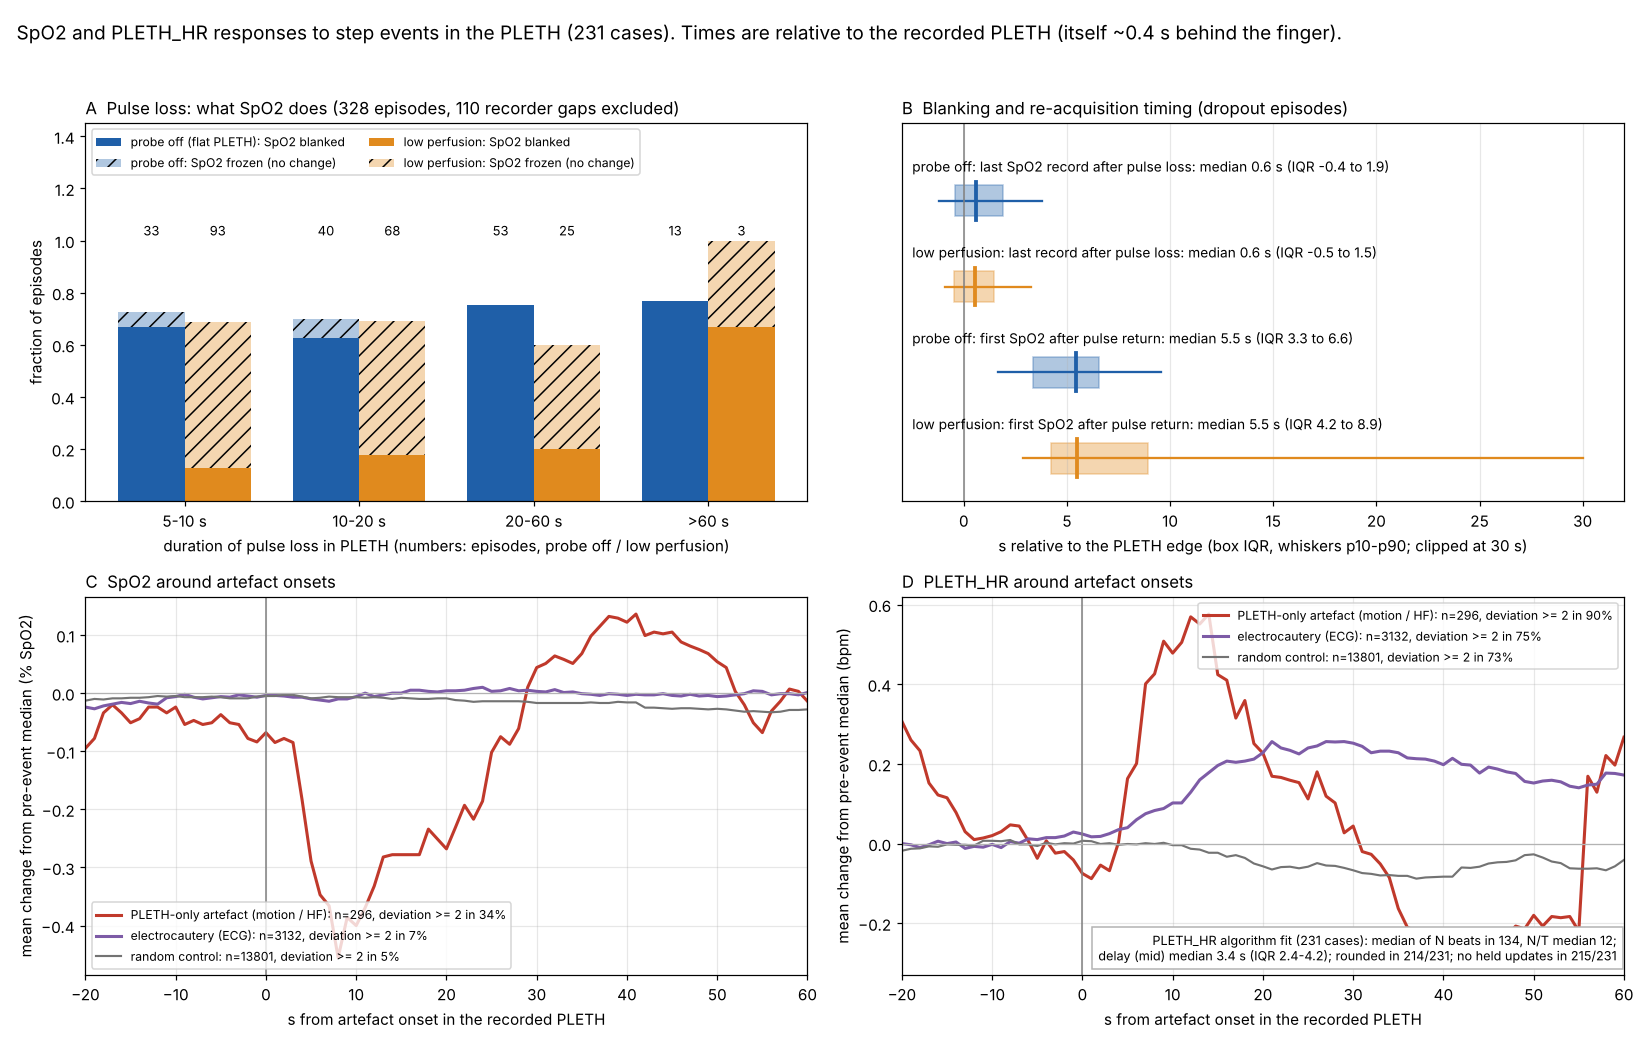
Probe off (flat PLETH) 139 SpO₂ blanks 0.6 s after pulse loss (IQR −0.4 to 1.9); first value 5.5 s after return
Low perfusion 189 SpO₂ mostly freezes rather than blanking (about 55–70% of 5–20 s episodes)
Electrocautery 3,132 No effect: 2% reach the PLETH; SpO₂ moves in 7% vs 5% at random
PLETH-only artefacts (motion) 296 SpO₂ moves ≥ 2% after 34%; dip starts +4 s, deepest +8 s, recovers by ~25 s
NIBP cuff inflation 991 Not usable: only 4 occluded the oximeter arm

PLETH_HR blanks and resumes at the same moments as SpO₂: one module.

Parameter Value Status From
SpO₂ onset latency about 4 s to the start of the dip, 8 s to its deepest; window 10–20 s (estimated) measured SpO₂ and pulse rate latency from step events

Discussion

These events time the oximeter's processing, not a true desaturation. The SpO₂ window (10–20 s) is an estimate, not a measurement.

Observations it supports

Observation Status Summary
SpO₂ freezes in low perfusion established During low perfusion SpO₂ mostly holds its last value rather than blanking (55–70% of 5–20 s episodes); when the probe comes off it blanks within about a second.

Worked examples

Example Side Status Summary
End-tidal to arterial CO₂, and pulse oximetry against blood gas, at the right moment time draft For 4,281 blood gases, reading the monitor when the blood was drawn rather than at the lab stamp makes changes in end-tidal CO₂ track changes in arterial CO₂ far better (within-patient correlation 0.74 against 0.54), and agreement peaks exactly at the estimated draw. Oximetry shows the same timing (agreement peaks at the draw), but the 100% ceiling hides the size of the oximetry gradient for three gases in four.

Code

Figures

Grouped bars of blanked or frozen fractions, box plots of timings, and two event-averaged response curves.
SpO₂ is blanked or frozen when the pulse is lost and returns about 5.5 s after the pulse comes back; PLETH artefacts move SpO₂ and PLETH_HR within seconds.