The PPG sawtooth and its correction
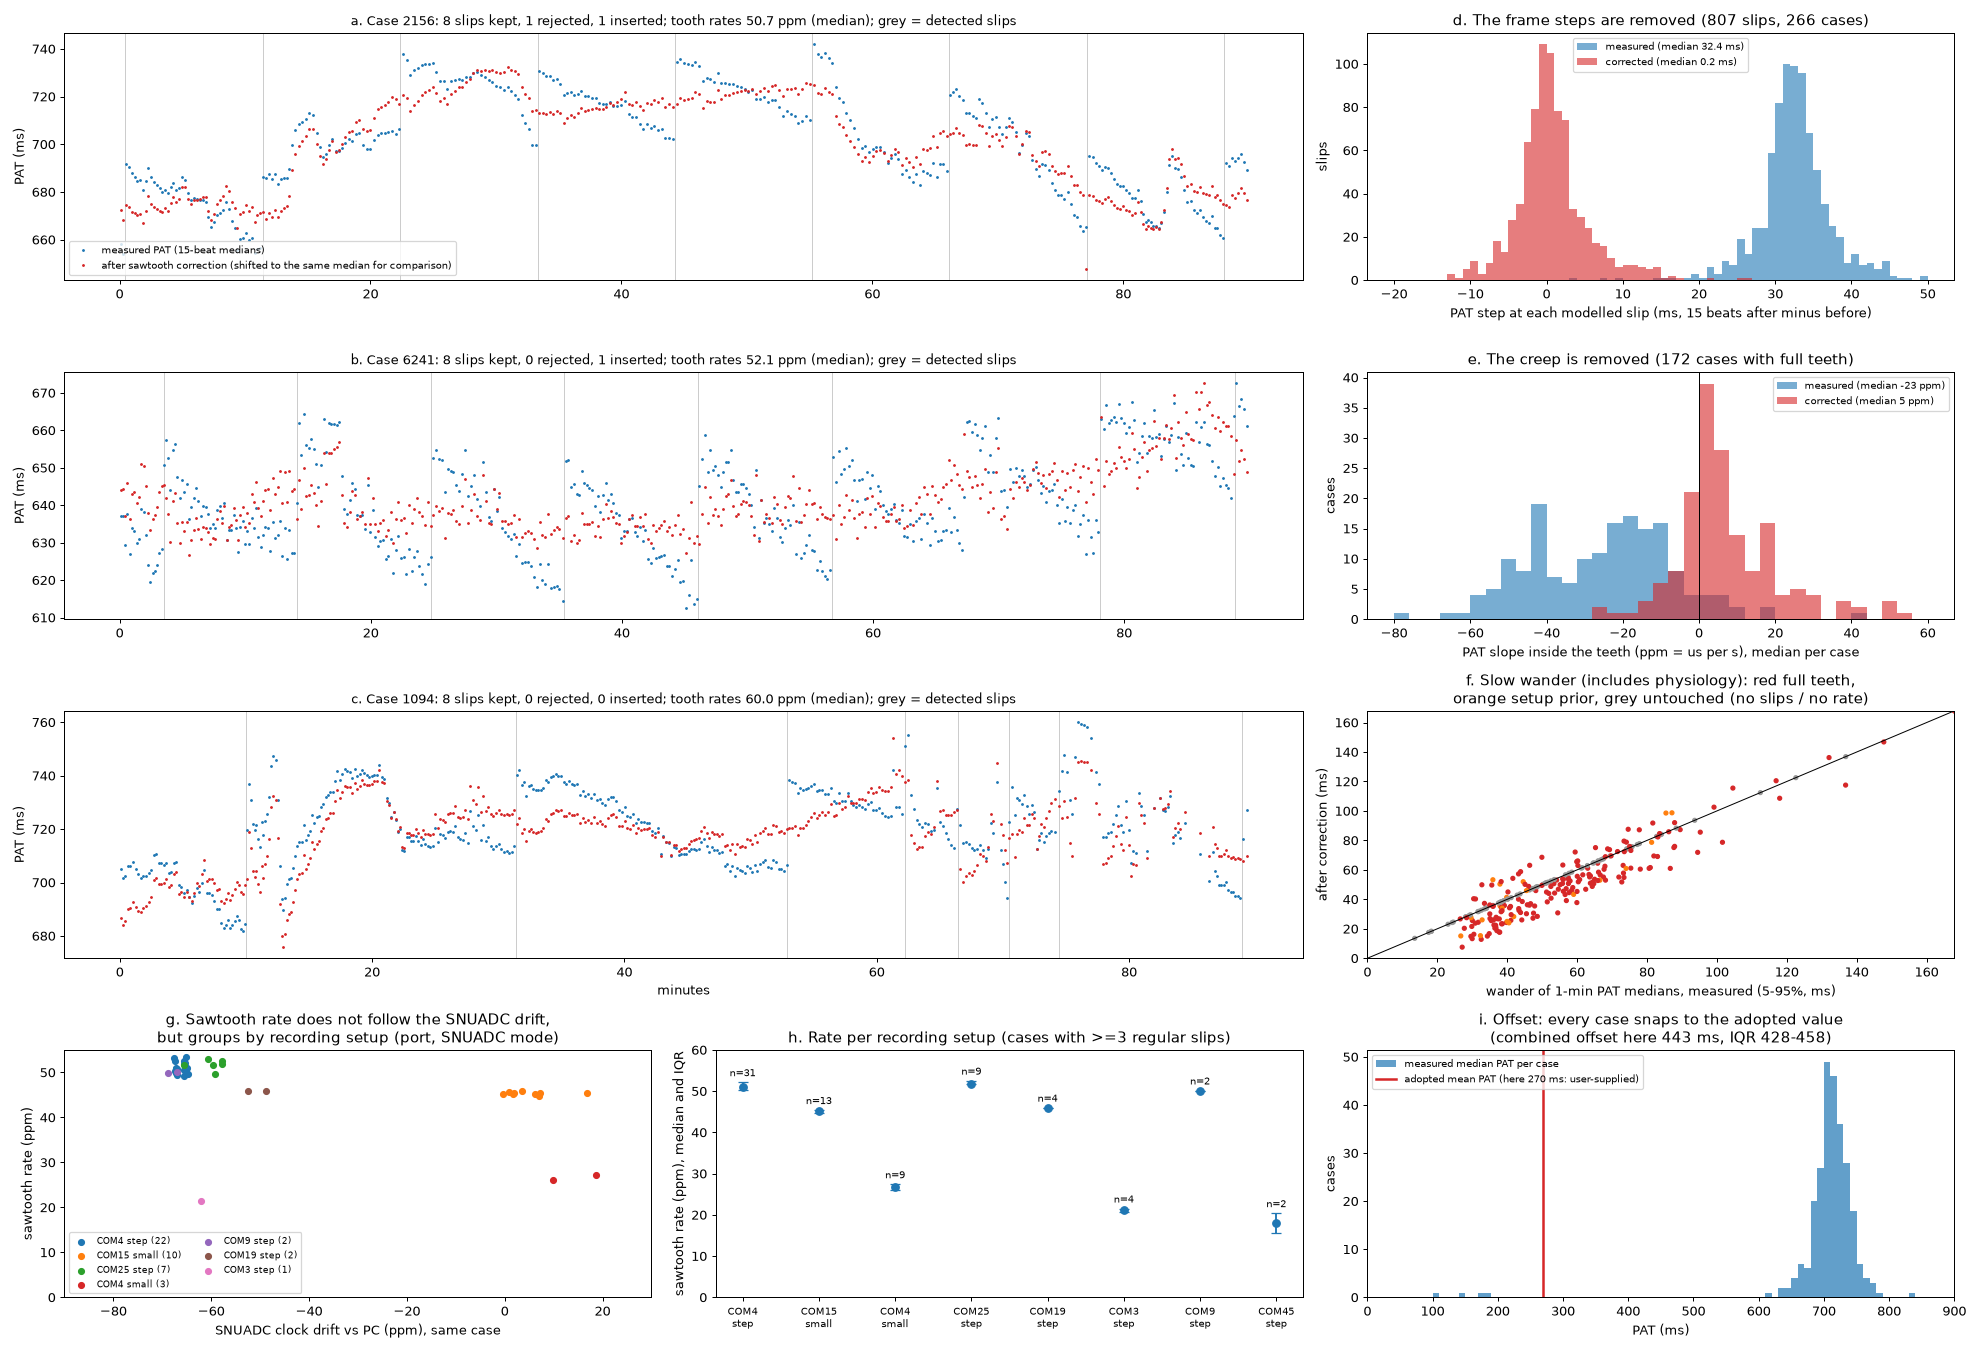
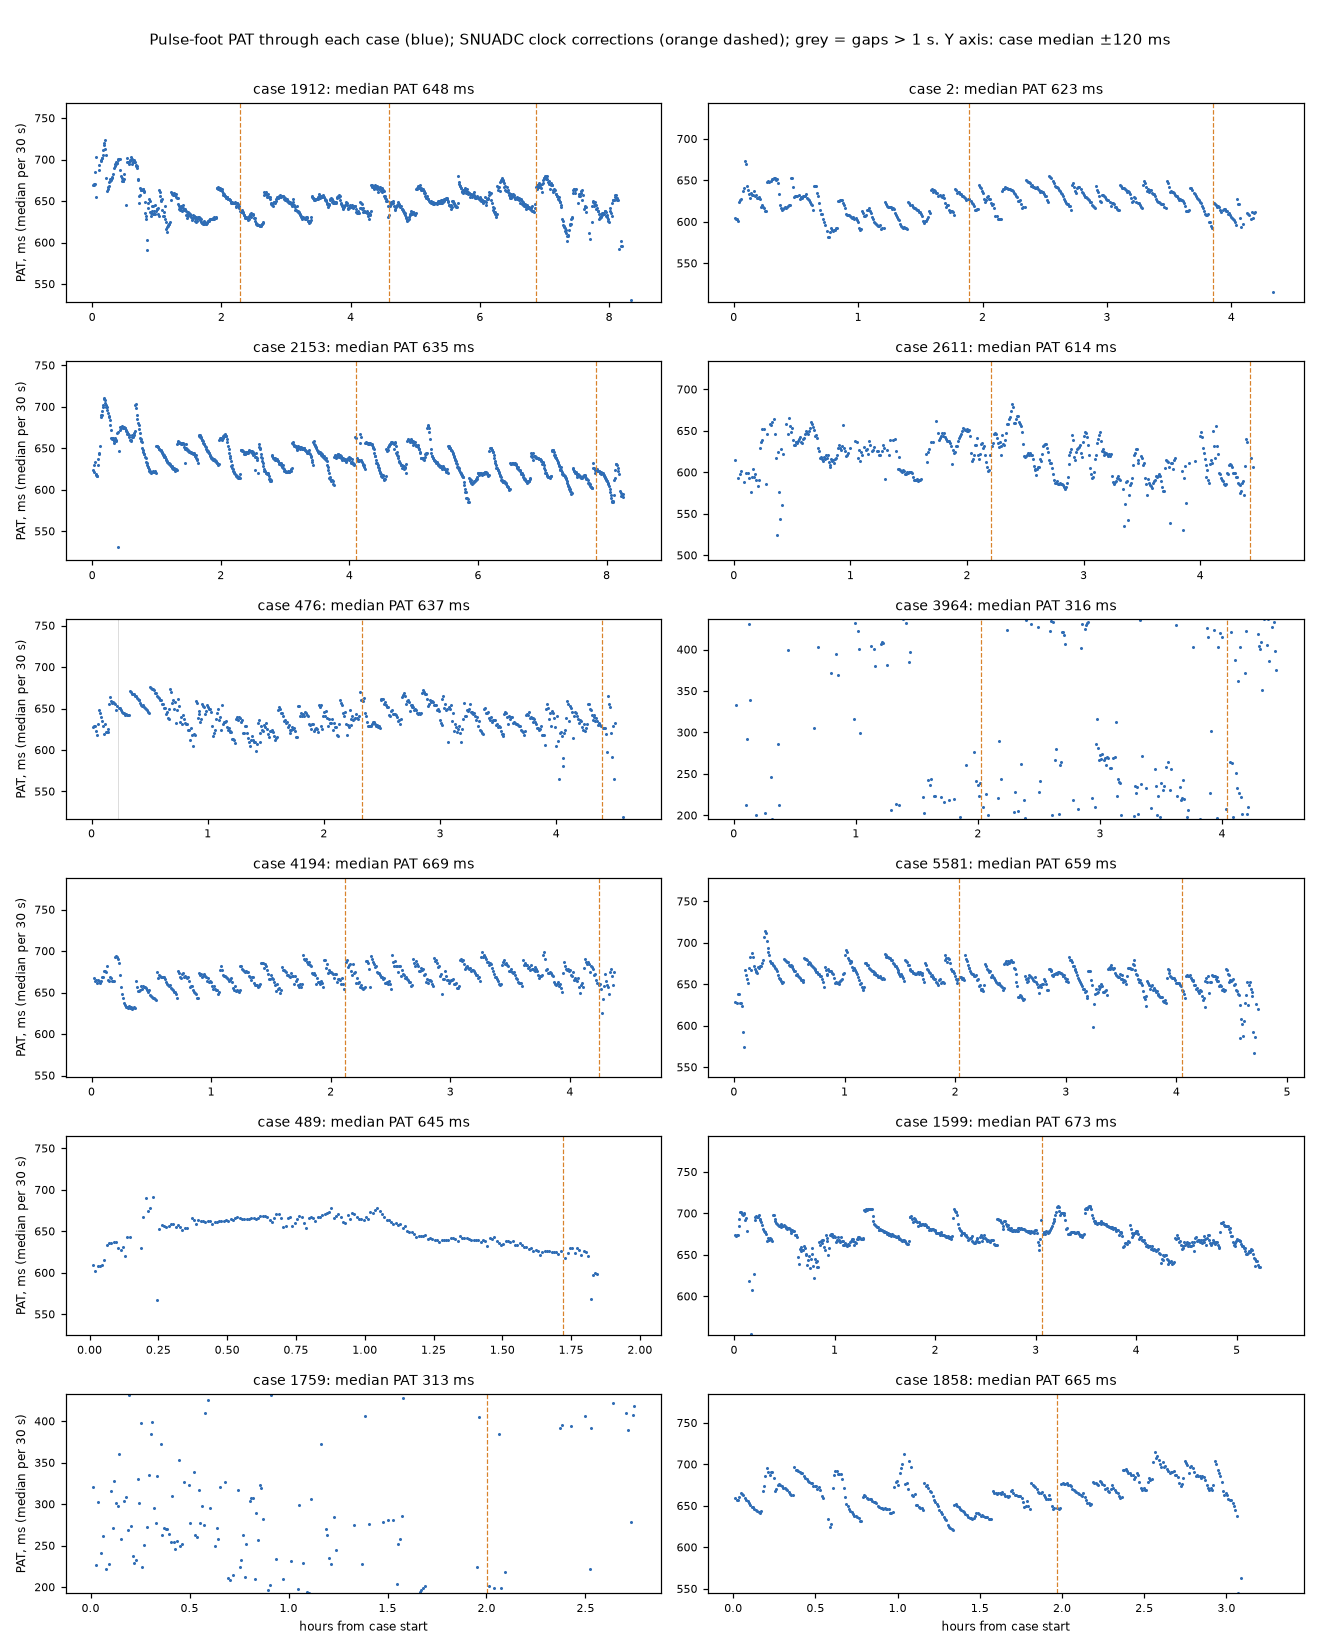
The ECG→PPG delay creeps at 18–52 ppm and jumps up by one 33.3 ms frame at each slip, every 11–31 minutes. A tooth-by-tooth model removes it; where the correction is confident it is essentially exact on injected test data.
| Date | 2026-10-10 |
| Status | current |
| Methods | Clocks carried in the signal |
| Techniques | Beat matching, Phase-step detection, Null controls |
| Clocks | Pulse oximeter frame clock, SNUADC sample clock |
| Devices | SNUADC, Solar8000 monitor |
| Variables | Plethysmogram (SNUADC), ECG lead II (SNUADC) |
Background
SNUADC samples ECG and PPG together, so its own drift cannot move one against the other. Any drift between them comes from inside the monitor.
Data
The same 266 cases (378 hours); a benchmark of a known sawtooth injected into 35 real recordings without one.
Method
The PPG delay is modelled as D(t) = offset + frame × (slips so far) − creep. The fit detects resets in the beat-matched pulse arrival time and keeps a slip only if it is one frame and falls between two beats (physiological changes build over several beats); puts back missed slips only where a gap holds whole teeth and the data show a step; gives each tooth the creep rate frame ÷ length, so a wrong slip distorts only its own tooth; and shifts the median to the adopted pulse arrival time. Each tooth gets a confidence tier: A (rate corroborated, clean slips, low noise), B, C, N (no sawtooth evident for 45 minutes or 1.5 teeth) or U (possibly affected, not corrected).
Results
- One frame per slip: the step has a median of 32.3 ms (IQR 30.4–34.8); other sizes are no more common than in a sign-flipped control.
- Regular: slips recur every frame ÷ rate, stable to about 0.2 ppm; a few recordings creep by about 1 ppm over 90 minutes.
- Fixed per setup, 18–52 ppm, unrelated to the SNUADC drift (r = −0.22) or the frame clock (r = 0.13). One port hosts two PPG sources: step-mode cases at 51 ppm and frequent-mode cases at 27 ppm.
- Invisible in the waveform: no repeated or held 33 ms segment at a slip (3.5% against 5% by chance).
| Tier | Share of injected time | Error after correction (RMS) | Time over 10 ms | Share of real time |
|---|---|---|---|---|
| A | 60% | 0.2 ms | 0.1% | 17.0% |
| B | 17% | 1.6 ms | 3.7% | 12.2% |
| C | 19% | 5.3 ms | 14% | 25.0% |
| U (not corrected) | 3% | 9.0 ms | 34% | 22.8% |
| N (no sawtooth) | 0.5% (wrongly) | — | — | 23.0% |
Uncorrected, the injected sawtooth has an RMS of 9.5 ms.
| Parameter | Value | Status | From |
|---|---|---|---|
| PPG sawtooth rate | 18–52 ppm by setup | measured | The PPG sawtooth and its correction |
| PPG slip size | 32.3 ms (IQR 30.4 to 34.8) | measured | The PPG sawtooth and its correction |
Discussion
Tiers A and B cover 29% of the real time analysed, 52% with the stretches where no sawtooth is running. The benchmark is optimistic: its physiology came from quiet recordings. Labels carry each tooth's tier, so a user can choose how much time to trust.
The last step of the fit, shifting each recording's median to the adopted pulse arrival time, also removes real differences between patients. One device delay for the PLETH across the release later showed that one global delay (385 ms, PPG hardware delay) fits the whole release, so the atlas removes that instead and keeps those differences (Pulse arrival time in two correction steps).
Observations it supports
| Observation | Status | Summary |
|---|---|---|
| The ECG→PPG delay is a sawtooth | established | Inside the oximeter the PPG content creeps 18–52 ppm against its 30 Hz frames; every 11–31 minutes a frame repeats and the delay jumps up by 33 ms. The rate is fixed per recording setup. |
| The PLETH arrives about 0.4 s late | established | Raw R-to-PPG-foot pulse arrival time in VitalDB has a median of 0.64–0.71 s, about 0.4 s more than physiology: the monitor's buffering and filtering. One delay fits the whole release: no clusters by setup, SNUADC port or case order (One device delay for the PLETH across the release). |
| The plethysmogram is built in 30 Hz frames | established | The SNUADC PLETH waveform comes from the oximeter in 33.3 ms frames, smoothed to 500 Hz. Its content changes once per frame, on the oximeter's own clock, about 0.4 s after the finger. |
Worked examples
| Example | Side | Status | Summary |
|---|---|---|---|
| Pulse arrival time against blood pressure, before and after synchronisation | time | draft | In 3,270 recordings, PAT tracks systolic pressure only once each pulse is paired with its own beat: the hourly correlation moves from a mean of −0.04 to −0.21 (88% of recordings negative), reproducing Ruffolo et al. 2025 in a second dataset; paired naively, PAT is a heart-rate signal. |
| Pulse arrival time in two correction steps | time | draft | The time from the ECG R wave to the pulse at the finger, as stored, after the PLETH's sawtooth is removed, and after its device offset is removed, smoothed by maximum likelihood, with the arterial line as the reference. |
Code
- physiosync:
physiosync/ecg_ppg.py,physiosync/labels.py - vitaldb-bench:
tools/tier_bench.py,tools/ppg_fix_check.py
Figures