Rounding and heaping of intraoperative urine output
Recorded intraoperative urine output is a mixture of 4 rounding modes (100 mL, 50 mL, 10 mL, 5 mL (base)); the model gives the true value's distribution for each record.
| Date | 2026-10-18 |
| Status | current |
| Methods | Rounding, heaping and value resolution |
| Variables | Intraoperative urine output |
Background
- Intraoperative urine output (
intraop_uo) is a hand-entered EMR total, probably charted on the anaesthesia record. - It was the first value variable worked through, and the per-variable checklist used for every later variable was written from it.
- The finest observed resolution is 1 mL, but almost every value is rounded to at least 5 mL, and two in five to 50 or 100 mL.
- A urine volume can be rounded at three points before it is charted: at the device graduation (H1), when readings are summed (H2), or when the final total is charted (H3).
Data
- 3,707 non-missing values; 2,681 cases are blank.
- 42% of cases have no urine output, probably because no catheter was placed. Cases without it are much shorter (median 1.8 h), so the latent distribution is conditional on catheterisation.
- 15 values (0.4%) are not multiples of 5 mL. They are flagged
off_gridand the resolution is overridden to 5 mL. - The 23 exact zeros were set aside in the original fit; since v0.6.0 they have their own rule (see Results).
- The fit uses the 3,669 positive values on the 5 mL grid.
Method
- First screen: each value was placed in one of five nested groups by the coarsest anchor it sits on (100, 50, 10, 5 or 1 mL), and the shares were compared with a flat, no-rounding expectation.
- Step 1, binned exploration: 100 mL bins centred on the 100 mL anchors, a flat latent within each bin, and propensities by back-substitution as in the manuscript's closed form.
- Step 2, parametric latent: a log-normal latent fitted jointly with the propensities by maximum likelihood. Plain nearest rounding (model A) was compared with distance decay for the 50 mL mode (model B).
- Step 3, log-spline latent: log f as a cubic B-spline in log volume, with K chosen by BIC. Tested a steeper decay shape, volume-dependent 50 mL rounding and a 25 mL mode.
- Step 4, robustness: 100 simulated datasets refitted from a generic start, a profiled hard-threshold capture window, a 1 mL-base sensitivity fit and a more flexible latent (K = 8).
- The final model is the threshold form: rounding to 50 mL only for true values within 20 mL of the anchor, at a rate that rises with volume.
Results
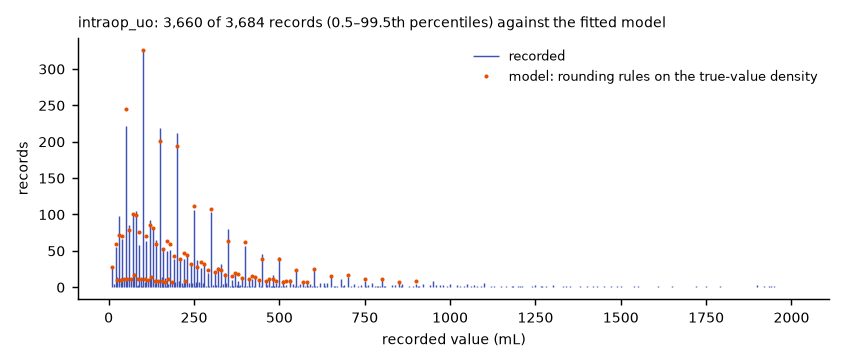
- On the first screen, 22.6% of values sit on 100 mL and 20.5% on 50 mL (not 100), against 1% each expected with no rounding. Only 0.4% are at 1 mL resolution.
- Values 10 mL from a 50 mL anchor are depleted: 677 records next to the anchors against 888 in the middle of each block. A smooth latent cannot do this. It matches Rietveld's distance-decay effect.
- Distance decay is real (likelihood-ratio statistic 22.4 on 1 df in step 2). A near-step decay shape almost matches the near/far counts (667 / 901 predicted against 677 / 888 observed).
- The log-spline beats the log-normal by 14.6 log-likelihood units for 2 extra parameters. A gamma latent fits clearly worse than the log-normal.
- A 25 mL mode is not needed: its fitted propensity goes to zero.
- A recorded 50, 100 or 500 mL is uncertain by roughly ±20–40 mL. A recorded 160 mL is uncertain by only ±5 mL, because 160 can only come from the 5 and 10 mL modes.
- A recorded 100 mL has only a 22% chance of having been read to 10 mL or finer.
- Grid of positive urine records by department (100 mL / 50 mL / 10 mL / 5 mL): gynaecology 40% / 33% / 27% / 0%, urology 29% / 49% / 22% / 0%, general 23% / 21% / 47% / 8%, thoracic 14% / 14% / 59% / 13% (chi-squared p < 10⁻³⁰). Among values of 100 mL or more, the share on the 100 mL grid is 55% in gynaecology, 43% in urology, 30% in general and 21% in thoracic surgery. Emergency and elective cases do not differ (p = 0.77).
- Since vitaldb-resolution v0.6.0 (18 October; model version 2): anaesthesia duration is a covariate of the
latent volume (BIC better by 926), and the rounding propensities depend on department (better by 87). Rounding
to the nearest anchor beats floor rounding (H1) by BIC, so the anchor is now tested. A recorded 0 has its own
rule: 9 zeros are flagged
zero_anuric(creatinine above 2 mg/dL or ASA 6) and 14zero_unexplained; for a recorded 0 the latent still carries about 54% of the posterior weight, so onlyzero_anuricstands for confirmed anuria.
Discussion
- Rounding looks similar across volumes and across elective and emergency cases. This argues against strong device-graduation effects (H1).
- Summing readings (H2) can explain multiples of 10, but not the extra 50 and 100 mL peaks. Those point to a charting preference (H3).
- The steep decay reads naturally as behaviour: a reading of 40 or 60 mL is rounded to 50 almost as often as one right on it, while readings 20–25 mL away are nearly as close to another 10 mL value.
- The threshold form was chosen over the smooth steep decay because it is simpler to explain and better identified. The best step, at 20 mL, is within 1.4 log-likelihood units of the smooth decay.
- The latent slope tilts each posterior. At 50 mL the latent is still rising, so the mean is pulled up to 50.9. At 500 mL it is falling, so the mean drops to 498.9.
- The 50 mL component spans ±20 mL, not ±25: the interval is the capture window, not the full half-resolution.
Limitations
- The decay steepness κ is not identifiable: in about half the simulation refits it ran off towards infinity. The data say "near-step" but cannot tell κ = 5 from a true step.
- The volume slope for 50 mL rounding is poorly determined in simulation (median 0.19, 95% interval 0.07–1.65).
- The nonparametric EM check was deferred, since K = 8 gives the same propensities. It would be run only if a reviewer asks.
- Correction, 13 Oct: the fitting code let the 100 mL mode round small true volumes to 0, which zero-truncation then silently dropped. After the fix the posterior weights moved by 0.01 or less.
intraop_uo.model.jsonholds the corrected fit. - Within each component the density is not flat. Until v0.6.0 the components were treated as uniform; the density within an interval is now computed on demand from the latent.
Open questions
- Thoracic records are much finer than gynaecology's (unexplained phenomenon). Thoracic surgery charts urine output mostly to 10 or 5 mL, gynaecology and urology mostly to 50 or 100 mL, even at the same volumes. The model now lets the rounding propensities depend on department (it improves BIC by 87), but why they differ is not known: a urometer with fine graduations in some theatres and a drainage bag in others would explain it. The urology split rests on 41 records.
Model
Model file: …/models/intraop_uo.model.json. Read from the pinned snapshot of vitaldb-resolution at commit bb03ddfc8a (2026-10-18).
How a true value becomes the recorded one. The rules are tried in order: a record not taken by an earlier rule is taken by this one with the probability shown (where its condition holds); the last rule takes the rest. Shares of all records depend on the conditions and the true value, so the model must be evaluated for them; the probabilities below are the fitted ones.
| Order | Rule | Rounds to | Probability if reached | Applies when |
|---|---|---|---|---|
| 1 | 100 mL | 100 mL (nearest) | 5.8 % | varies with department |
| 2 | 50 mL | 50 mL (nearest) | 38.7 % | true value within 20 of the rounded one; varies with department; varies with the value (shown at 160) |
| 3 | 10 mL | 10 mL (nearest) | 75.4 % | varies with department |
| 4 | 5 mL (base) | 5 mL (nearest) | the rest | always |
| Recorded resolution | 1 (modelled at 5) |
| True-value density | log_spline |
| Covariates | department |
| Fitted on | 3,630 records (VitalDB clinical_data.csv (intraop_uo), positive values on the 5 mL grid with a usable anaesthesia duration) |
| BIC | 30,008 |
| Fitted | 2026-10-18 |
- Only 15 of 3,707 values (0.4%) are not multiples of 5; treated as typos or over-precise readings and flagged off_grid.
Worked examples
| Example | Side | Status | Summary |
|---|---|---|---|
| A regression that carries rounding uncertainty through | value | draft | Acute kidney injury after surgery against intraoperative urine output (mL/kg/h), fitted once on the recorded numbers and once per draw from the true-value distributions: the rounding moves 14% of cases across the oliguria threshold, but widens the confidence interval of the cohort's regression by at most 4%. |
| Intraoperative fluid balance as a distribution | value | draft | Fluids in minus fluids out, each a heaped charted volume, as a distribution per case: the recording alone makes a balance uncertain by about ±60 mL, and by ±190 mL when the blood loss was written as a round 500 mL. |
| Oliguria labels for a prediction model | value | draft | One label per patient, oliguric or not, from three rounded numbers: 10% of labels are uncertain and 2.6% are expected to be wrong, which sets a floor under the error any model can be measured to have. A typical model is barely affected; a good one is. |
| Urine output in mL/kg/h as a distribution | value | draft | Intraoperative urine output per kilogram per hour, from three rounded inputs, as a probability distribution per case: one case in ten cannot be placed confidently on either side of 0.5 mL/kg/h. |
Code
Tags: generated, vitaldb-resolution