How the monitors compute their numbers
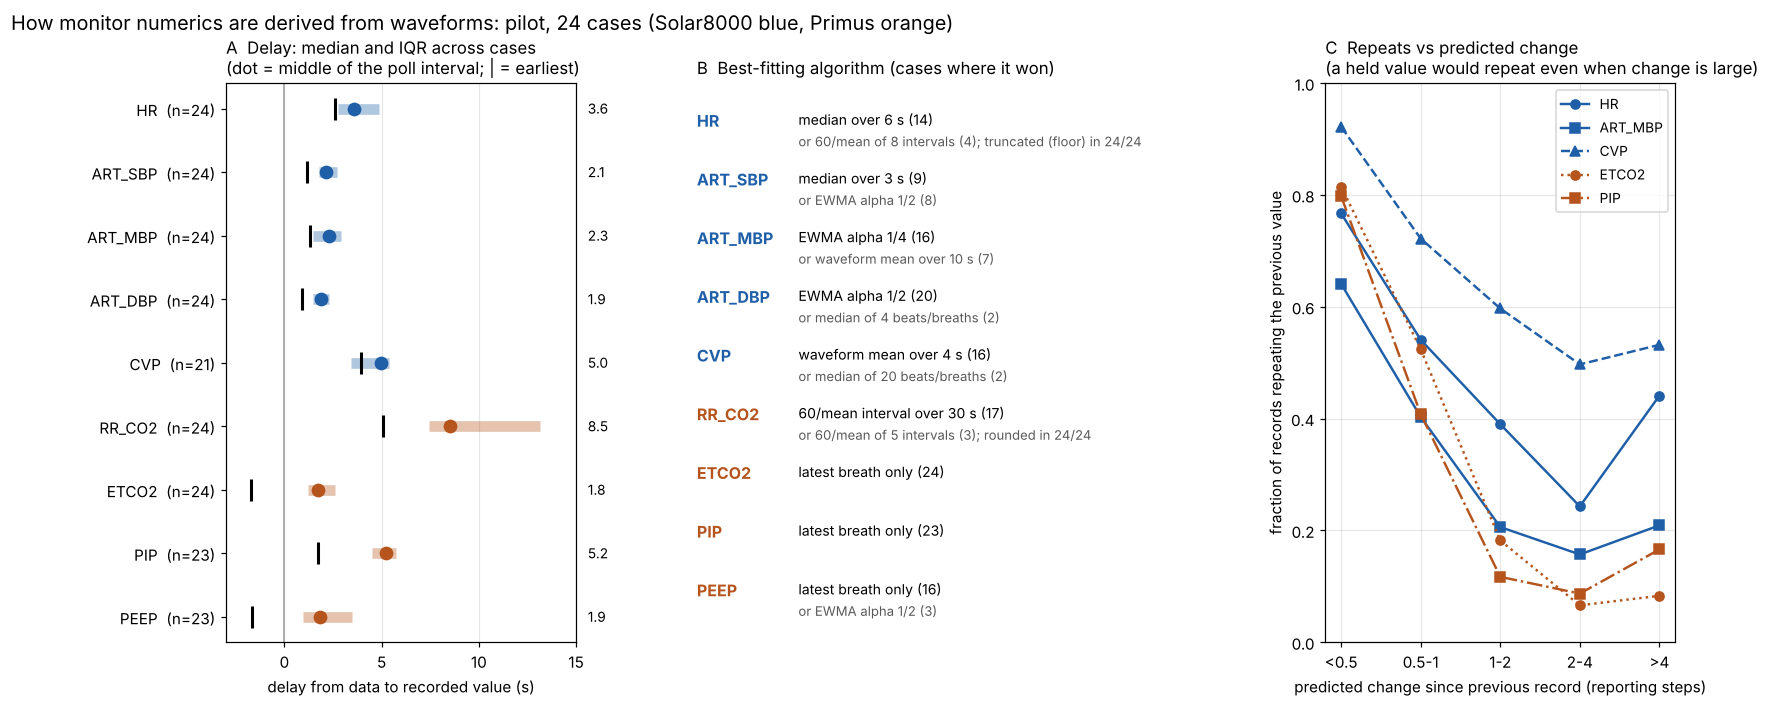
Recomputing each monitor numeric from its own waveform finds a short, simple algorithm for every one (a median, an exponential average or a time mean over 3–30 s) and a delay of 2–9 s behind the newest data it uses. No value is stamped before its data exist.
| Date | 2026-10-12 |
| Status | current |
| Methods | Delays and averaging windows |
| Devices | Solar8000 monitor, Primus anaesthesia machine, BIS monitor |
| Variables | Solar8000 heart rate, Solar8000 ART and CVP numerics, Solar8000 pulse rate (PLETH_HR), Primus ETCO₂, PIP and RR, ECG lead II (SNUADC), Arterial pressure (SNUADC), Capnogram (Primus), Airway pressure (Primus) |
Background
A numeric summarises a window of signal that ended before its stamp. Knowing the window and the delay lets a value be placed against the physiology it describes, and tells a model when the value could first have been known.
Data
Record rates on 1,000 random cases. The algorithm fit on 24 cases with ECG, arterial pressure, CVP and Primus waveforms; PLETH_HR on 231 cases.
Method
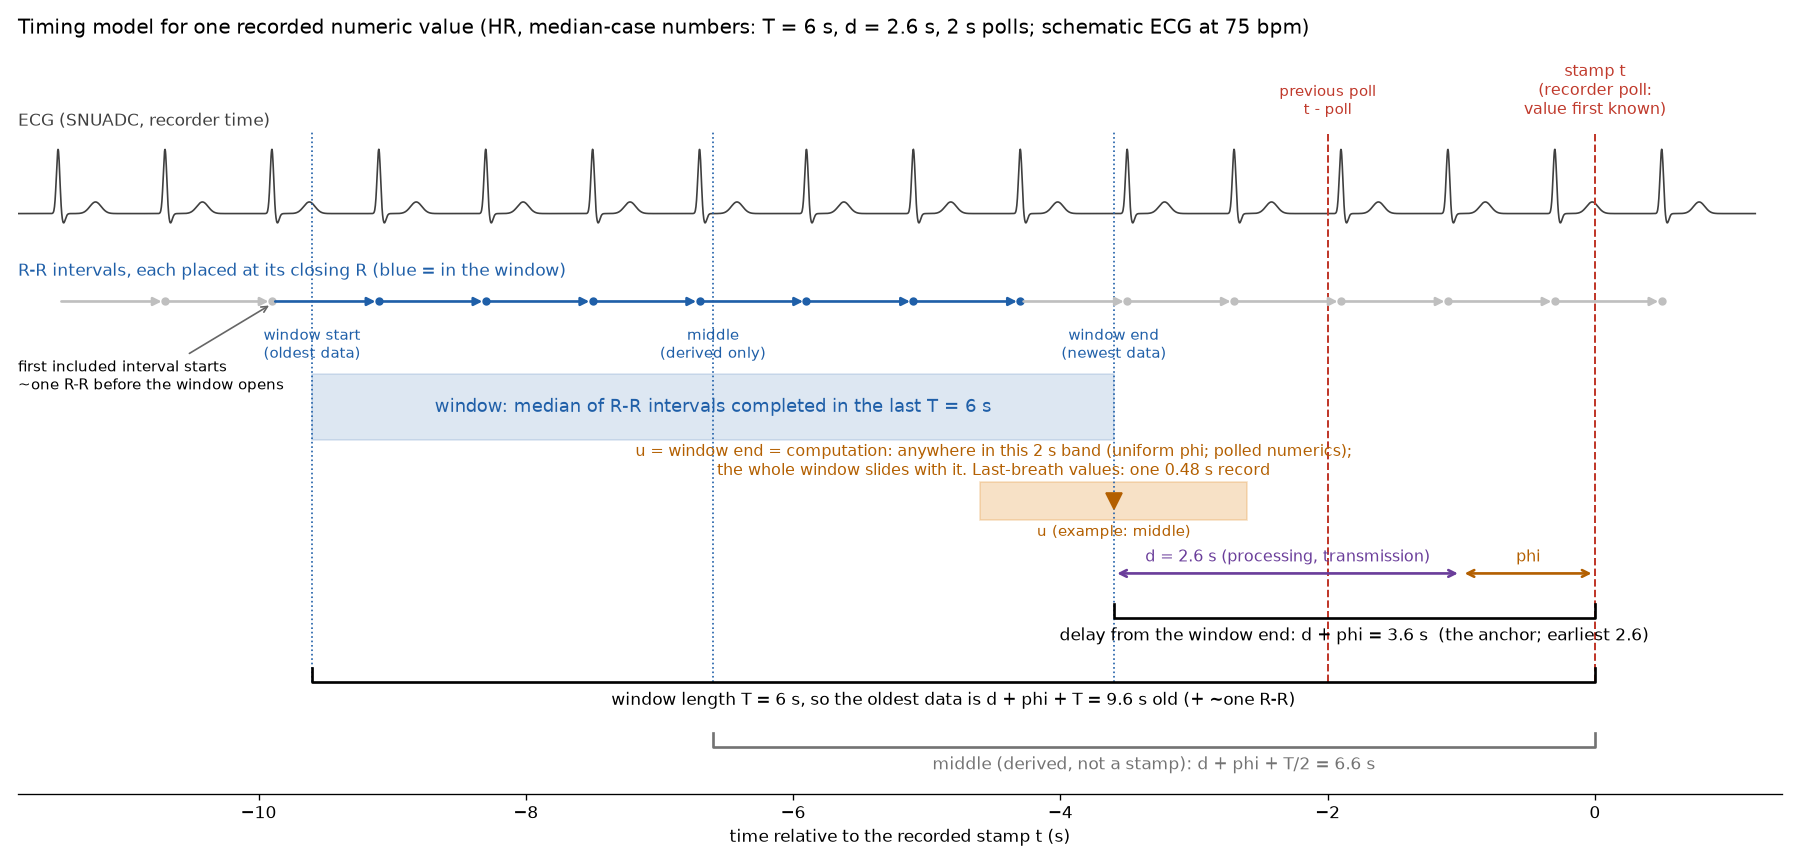
Timing model. A value stamped at t is computed at u = t − d − φ from the data in a window ending at u: d is the processing and transmission delay, and φ is where within the device's update phase the computation fell (uniform over one poll for values the monitor recomputes on its own schedule; over one 0.48 s record for Primus values of the last completed breath). Values are uniform over their reporting bin (rounded or truncated). Every delay is measured from the window's end, the anchor; the window's middle is a derived description only.
Fit. Each numeric was fitted against beat-by-beat or breath-by-breath values from its waveform. Candidates: a mean, median or exponential average over N events or T seconds, rate and waveform-mean variants, delays from −3 to 15 s; the best by likelihood per case. A held-value model (refreshing every 4–12 s) was the alternative.
Results
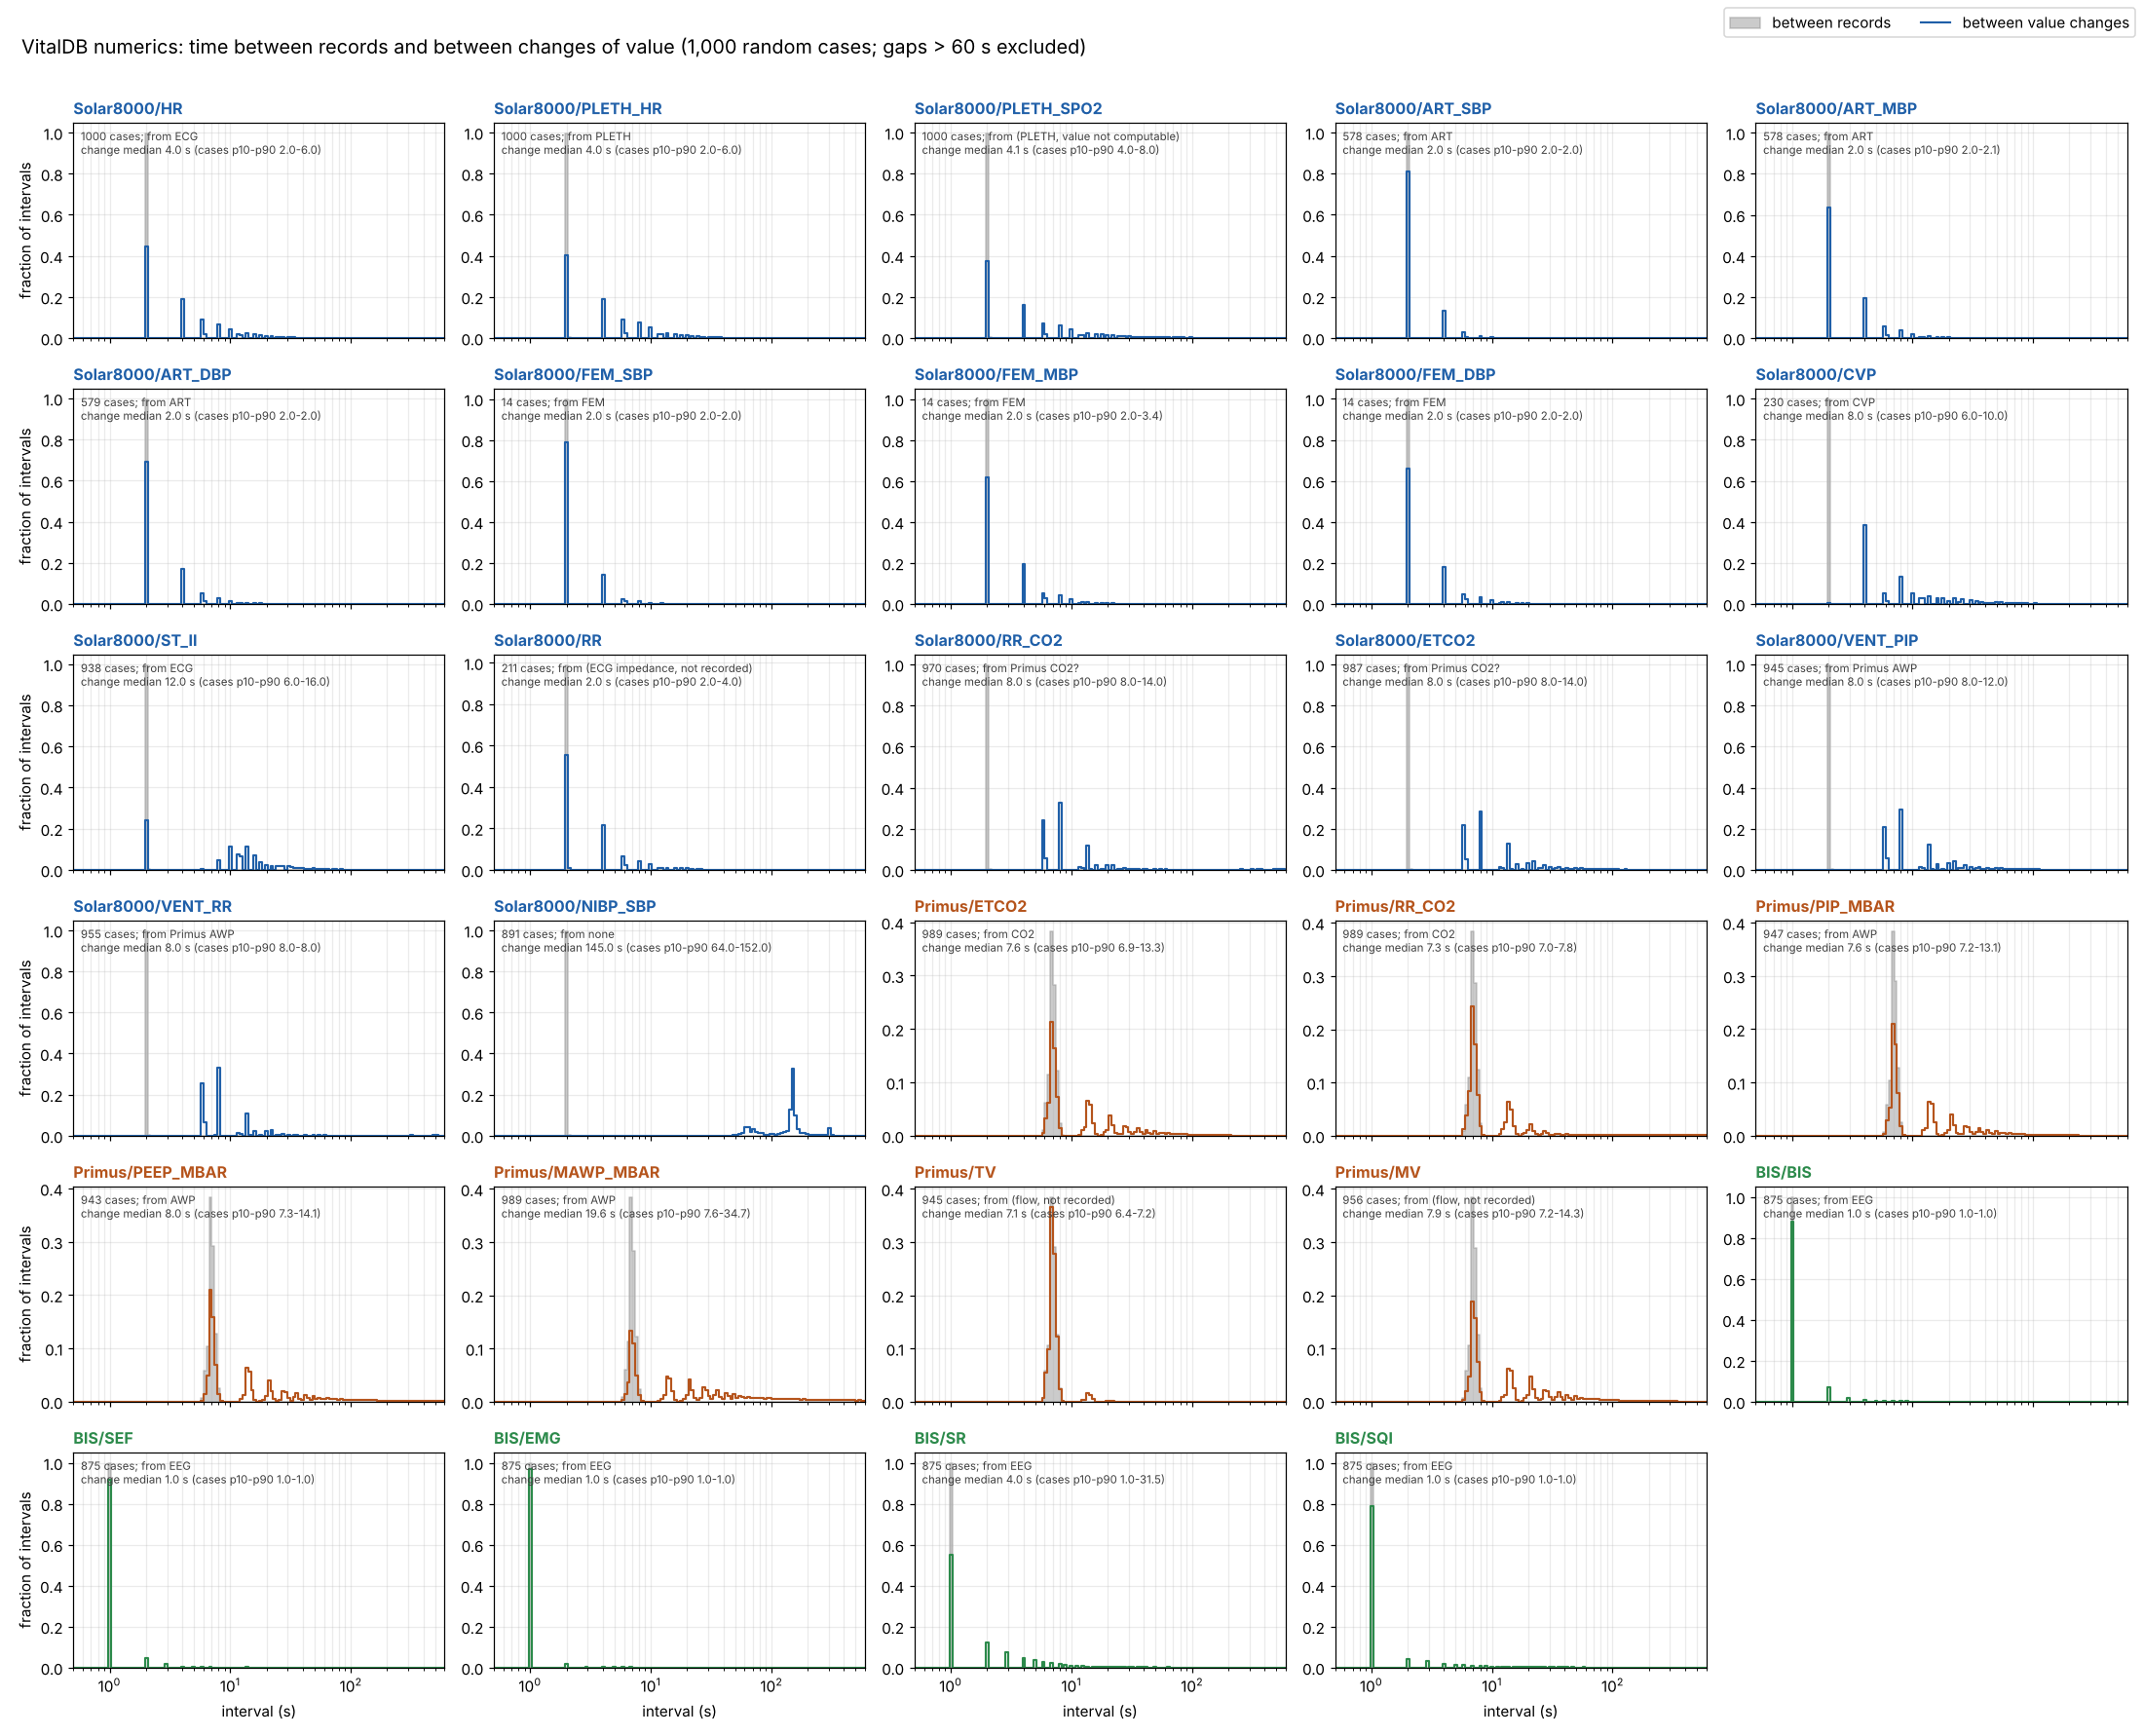
Record rates: Solar8000 every 2.00 s (99% within ±50 ms), BIS every 1.00 s, Primus about every 7.0 s (or 6.3 s; ±0.4 s, not locked to breaths). Solar8000's ETCO₂ and ventilator values change only every 6–8 s: Primus values relayed through the Solar8000. Every Solar8000 ST_II record is written twice at the same stamp.
| Numeric | Best fit (cases) | Delay from window end |
|---|---|---|
| HR | median R–R over ~6 s, truncated (14/24) | 3.6 s |
| ART systolic | median over 3 s, or EWMA ½ | 2.1 s |
| ART mean | EWMA ¼ per beat (16/24) | 2.3 s |
| ART diastolic | EWMA ½ (20/24) | 1.9 s |
| CVP | waveform mean over 4–5 s (16/21) | 5.0 s |
| PLETH_HR | median of ~12 beats (134/231) | 3.4 s |
| Primus RR | 60 / mean breath interval over 30 s (17/24) | 8.5 s |
| Primus ETCO₂, PEEP | the latest breath | 1.8–1.9 s |
| Primus PIP | the latest breath | 5.2 s |
- No slow updates: the held-value model lost in every case for HR, ART, CVP and PLETH_HR.
- HR is truncated, not rounded (24/24); RR clearly rounds.
- No front-stamping: no numeric is stamped before the data it describes.
| Parameter | Value | Status | From |
|---|---|---|---|
| Solar8000 HR window | about 6 s (best 6–8 s in both delay groups) | measured | How the monitors compute their numbers |
Discussion
Mean against median, or beats against seconds, often differ by only 0.01–0.05 log-likelihood per record, so the algorithm family is less certain than the delay. Pressure numerics sit about 4 mmHg below the analogue waveform in these cases (scale, not timing); over the whole release the median is −1.2 mmHg, varying by about ±6 mmHg between patients (Minutes of hypotension per patient, from the monitor and from the waveform). Delays here are pilot values; Numeric delays are fixed within a case, different between cases measures them in every case.
Observations it supports
| Observation | Status | Summary |
|---|---|---|
| Monitor numerics describe the past, never the future | established | Every monitor numeric describes a window of 3–30 s or more that ended 1–9 s before its stamp. None is stamped before its data exist, so the stamps already respect the availability rule. |
| Solar8000 ST records are written twice | established | Every Solar8000 ST_II record is duplicated at the same stamp (0–20 ms apart). |
| Solar8000 heart rate is truncated, not rounded | established | The Solar8000 heart rate drops its fraction (floor), in 24 of 24 pilot cases; the respiratory rate rounds. |
| The Solar8000 relays the Primus's ventilation numbers | established | Solar8000 ETCO₂, RR_CO2, VENT_PIP and VENT_RR change only every 6–8 s: they are Primus values passed on through the Solar8000's 2 s polling, not measured by the monitor. |
Worked examples
| Example | Side | Status | Summary |
|---|---|---|---|
| Cuff pressure against the arterial line | both | draft | 12,238 cuff readings against the arterial line at the cuff's own moment, in 2,283 patients: no bias over the cohort at any pressure, but each patient's cuff reads a constant 10 mmHg (SD) above or below their line, and half the arterial readings below 65 mmHg are not below 65 by cuff. |
| Minutes of hypotension per patient, from the monitor and from the waveform | both | draft | Minutes with MAP below 65 mmHg in 3,476 recordings, from the monitor's numeric and from the arterial waveform's beats: the two routes to one pressure differ by several mmHg per patient, which moves half of all patients' minutes by 5 or more and a fifth of their labels, and the numeric's averaging hides short dips in every patient. |
Code
Figures