Operation start time
Operation start time; from casestart (clinical table).
| Name in the dataset | opstart |
| Type | time |
| Stored in | clinical_data.csv |
| Stamped by | Hospital records clock |
| Unit | sec |
Description
Charted clock minute modelled as an offset from the recording start (device time). See the Timestamps section.
How its time was recorded is described with Anaesthesia record events.
Measurement space
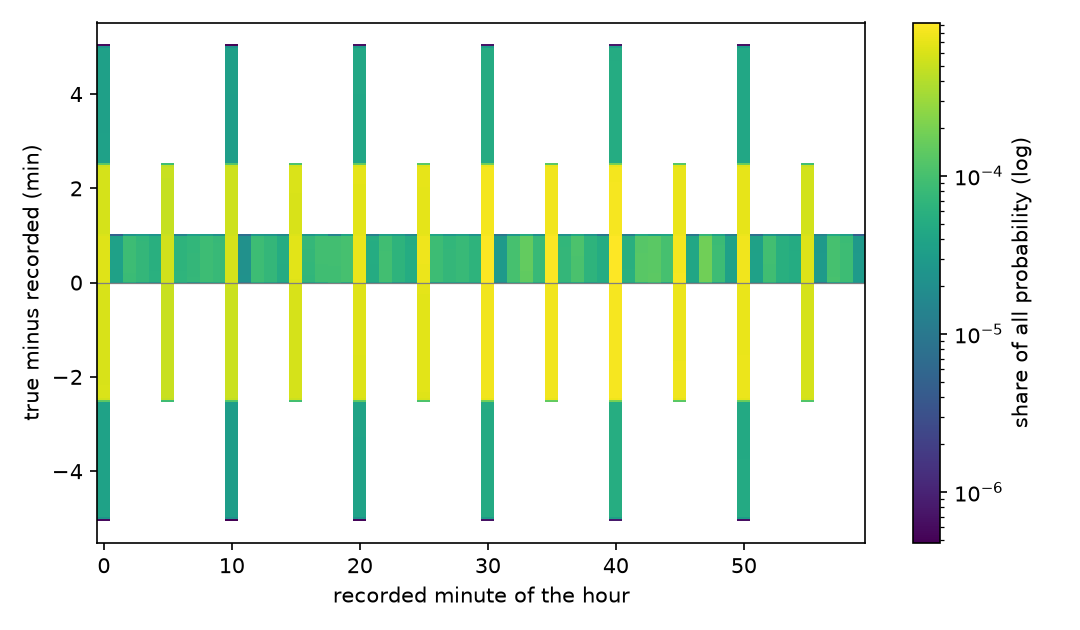
Vertical slices through the measurement space: how the true value is spread around a recorded one, for 2 recorded minutes of the hour chosen to show the different cases. Each panel has its own scale. Each is averaged over every record with that minute in the release, from the pinned model; groups of fewer than 20 records are not shown.
- :40 (the commonest recorded value; 637 records): mean -0.00503 min, SD 1.66 min, 95% between -2.85 and +2.71. Rounding: nearest_5min 87%, nearest_10min 11%, clock_minute 2%.
- :47 (the narrowest; 25 records): mean +0.503 min, SD 0.289 min, 95% between +0.00469 and +0.955. Rounding: clock_minute 100%.
Time
Its time side is still to be described.
Value
| Model kind | timestamp_model: fitted reference-offset model; posterior over the true event time |
| Resolution | heaped: a mixture of rounding modes (see the value model) |
| Status | measured |
| Studies | How the operation start time was charted |
In this release
How wide the true-value distribution is, record by record, over 6,387 of 6,388 records (all clinical rows) that have one. Computed with the pinned model, aggregates only.
| Median | p10 to p90 | |
|---|---|---|
| Standard deviation | 85.9 sec | 82.6 to 99.5 sec |
| 95% interval width | 285 sec | 281 to 352 sec |
| Mean minus recorded | -1.85 sec | -10.6 to 28.9 sec |
Value model
Model file: …/models/opstart.model.json. Read from the pinned snapshot of vitaldb-resolution at commit bb03ddfc8a (2026-10-18).
How a true value becomes the recorded one. The rules are tried in order: a record not taken by an earlier rule is taken by this one with the probability shown (where its condition holds); the last rule takes the rest. With no conditions, the shares follow directly.
| Order | Rule | Rounds to | Probability if reached | Share of records |
|---|---|---|---|---|
| 1 | nearest_10min | 10 clock minute (nearest) | 5.6 % | 5.6 % |
| 2 | nearest_5min | 5 clock minute (nearest) | 89.6 % | 84.6 % |
| 3 | clock_minute | 1 clock minute (floor) | the rest | 9.8 % |
| Recorded resolution | 1 min (chronon) (modelled at 1) |
| True-value density | reference_offset_spline |
| Covariates | ref |
| Fitted on | 6,387 records (clinical_data.csv) |
| BIC | 36,239 |
| Fitted | 2026-10-18 |
Time and value together
Coupled. The value is itself a time: its value side and its time side are the same uncertainty.
Studies
| Study | Date | Status | Summary |
|---|---|---|---|
| How the operation start time was charted | 2026-10-18 | current | The charted operation start time is a mixture of 3 ways of writing a clock time (nearest_10min, nearest_5min, clock_minute), modelled as an offset from a device time. |
Figures
Tags: generated, vitaldb-resolution