VitalDB metrology atlas
Work in progress
Pre-release, open for review (v0.1.0, October 2026). This first public version accompanies a preprint and is released for review by the community and the dataset's custodians ahead of a peer-reviewed journal version. Comments are welcome as issues or discussions on GitHub.
Studies are still being added and revised, some numbers rest on small runs, and many questions are open. Every page says how its numbers are known. If you find something wrong, or can settle an open question, please contribute: corrections, better models and new studies are all welcome.
The studies, code and pages were developed with substantial assistance from an AI assistant (Claude, by Anthropic), under the author's direction and review. Mistakes may remain; how this atlas was made says more.
Every recorded value in the VitalDB open dataset (6,388 surgical cases, PhysioNet release 1.0.0) as a probability distribution over when it happened and what it was, with the studies that measured each part.
A record in VitalDB is a pair: a recorded time and a recorded value. In the language of metrology, each record is an indication of two measurands: when the thing it describes happened, and what its value was. Neither is recorded exactly. The time comes from one of a dozen clocks that drift and are corrected in jumps, and often describes a window that ended earlier; the value was rounded, sometimes heaped by hand, and measured by an instrument with its own error.
For every variable, this atlas states the measurand, the measurement model that links it to the recorded pair, and what is known about the measurand given a record, as a joint probability distribution over its true time and true value (the multivariate case of the GUM, Supplement 2). Every part of the model carries its evidence: the study it came from and how it was evaluated (measured from the data, or estimated and assumed). With the distributions known, uncertainty can be propagated through any calculation on the data (the GUM, Supplement 1). Aim and terms states this aim in full and maps the atlas onto the international vocabulary.
It is a metrology of recorded data: the measurements were made long ago, so each part of the model is reconstructed from the records themselves.
All clock rates are relative. Each is measured against another clock that also drifts, and the page says which. Every clock is linked, directly or through others, to the recorder PC (Recorder PC clock); its link to UTC cannot be observed in the release and is assumed, so no time here is metrologically traceable to UTC: the chain is broken at its first link.
System overview
VitalDB records each operating room with one PC running Vital Recorder. Every device sends its data to that PC, which stamps each record. The waveforms that matter most for timing come through SNUADC, a 500 Hz converter that samples the patient monitor's analogue outputs (ECG, arterial pressure, plethysmogram, CVP); the BIS monitor, the Primus anaesthesia machine and a handful of haemodynamic monitors send their own waveforms and numbers, each on its own clock. The patient monitor's numbers (heart rate, pressures, SpO₂) arrive as single values that describe a window of signal which ended seconds before their stamp.
So a time in VitalDB can be off in two ways: the clock that made it drifts and is corrected in jumps, and the value it is attached to describes an earlier interval. The chart below places every kind of time stamp on both axes.
The links in the timing graph
| # | Link | Clock | Against | Drift | Corrected every | Correction size | Status |
|---|---|---|---|---|---|---|---|
| 1 | Recorder PC against UTC | Recorder PC clock | UTC | 0.1–10 ppm (assumed) | 8–24 h (assumed) | — | assumed |
| 2 | Primus against the recorder PC | Primus clock | Recorder PC clock | +104 ppm | about 7,230 s (2.0 h; p90 twice that) | -0.016 s (whole 16 ms samples either way; median −16 ms (one sample back), p10–p90 −144 to +144 ms) | measured |
| 3 | CardioQ against the recorder PC | CardioQ clock | Recorder PC clock | — | at most about 300 s; about 40 re-anchors per case | — | measured |
| 4 | CardioQ against SNUADC | CardioQ clock | SNUADC sample clock | — | — | 0.4–4.4 s (p5–p95); matched-beat MAD 0.24 s (24 cases) | measured |
| 5 | SNUADC (frequent-correction mode) against the recorder PC | SNUADC sample clock | Recorder PC clock | -0.954 ppm | — | +5 to +15 ms (median +10), about one an hour (median 1.1 per hour per recording) | measured |
| 5 | SNUADC (step mode) against the recorder PC | SNUADC sample clock | Recorder PC clock | -63 ppm | 2.08 h | about 0.498 s true (paced: 0.4981–0.4988 s); −0.480 s on the stamps | measured |
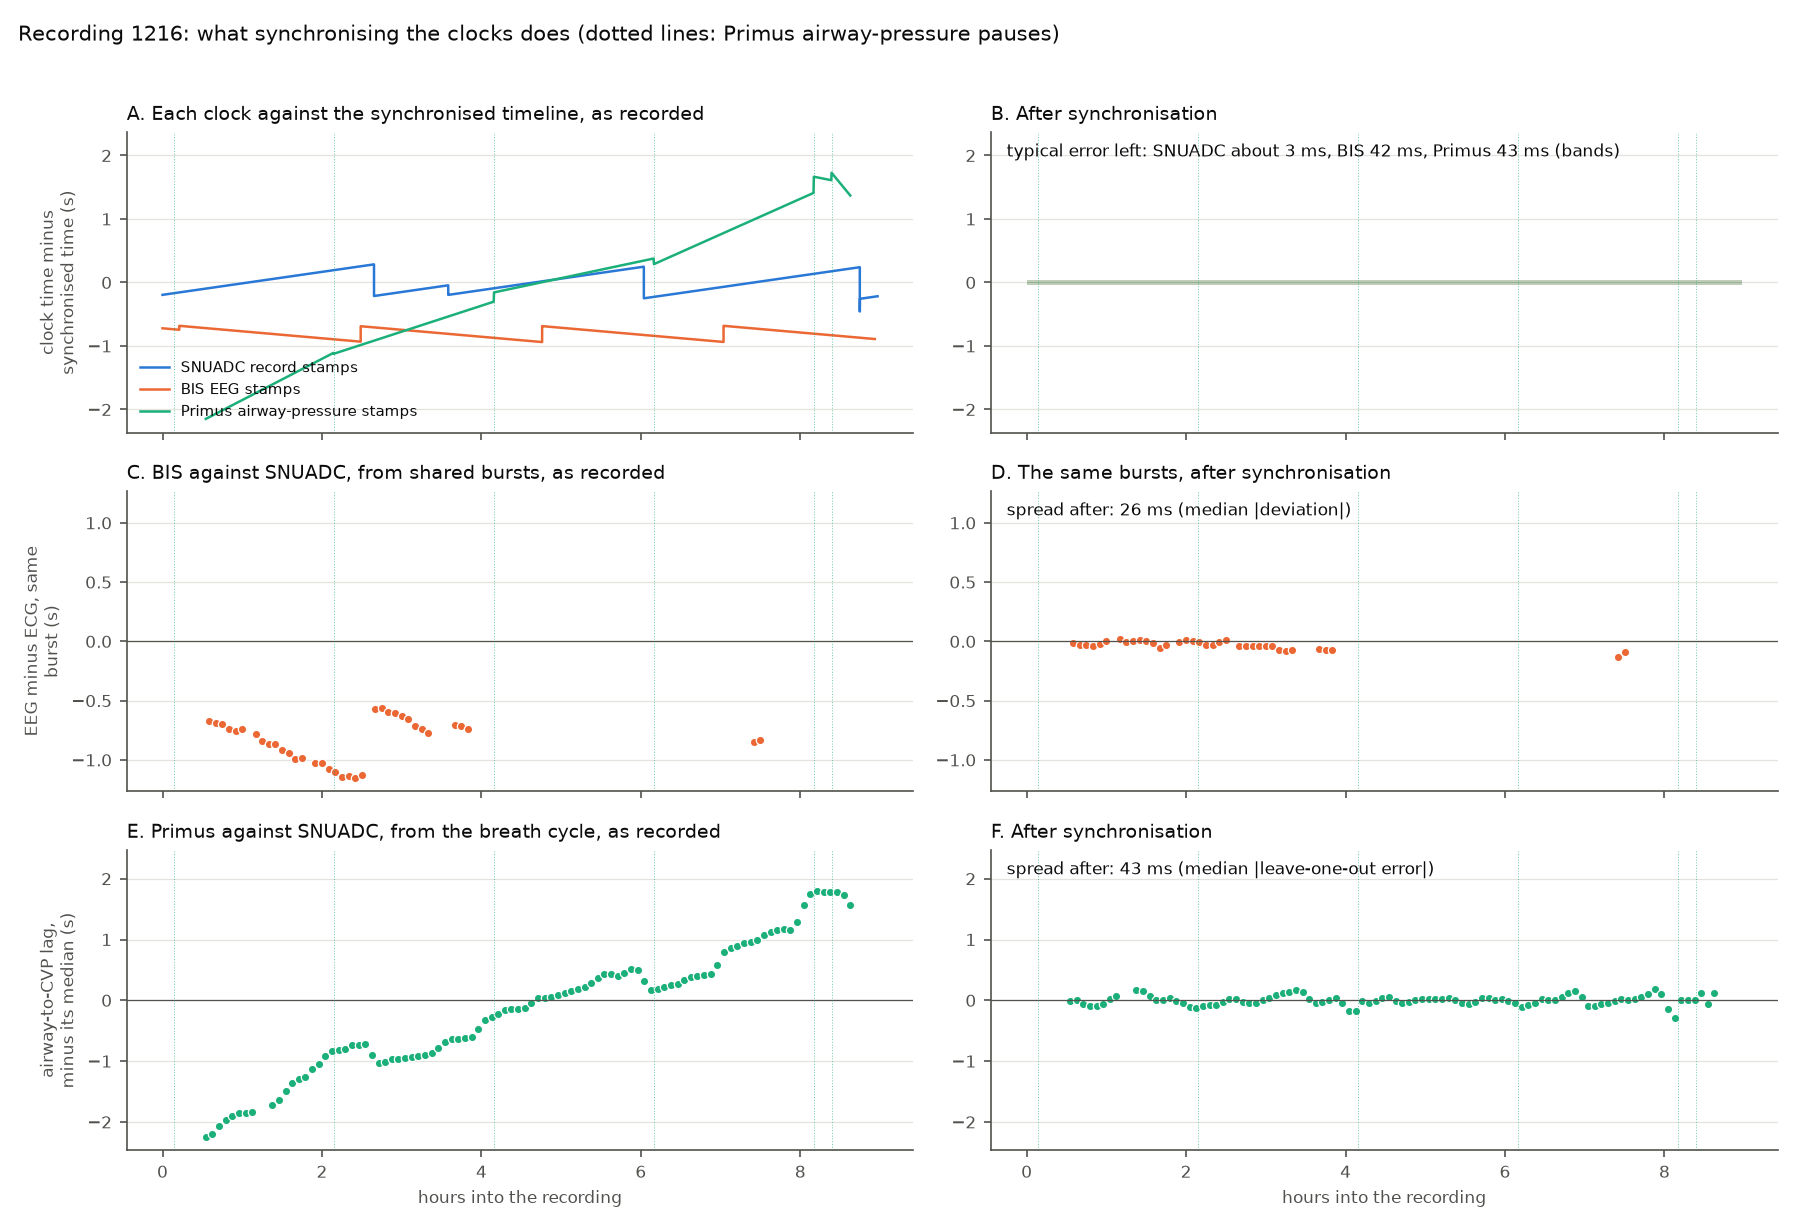
| 6 | BIS against the recorder PC | BIS clock | Recorder PC clock | +25 ppm | 8,192 s (2 h 16.5 min), ± 20 s in 95% of intervals | 0.17 s median | measured |
| 7 | BIS against SNUADC | BIS clock | SNUADC sample clock | -72 ppm | — | — | measured |
| 8 | Hospital records clock against the recorder PC | Hospital records clock | Recorder PC clock | — | — | — | assumed |
| 9 | Oximeter frames against SNUADC | Pulse oximeter frame clock | SNUADC sample clock | +7 to +92 ppm by setup (medians over 42 PC keys); within 3 ppm of its setup's median in 89% of recordings | — | — | measured |
| 9 | PPG content against the oximeter frames (the sawtooth) | Pulse oximeter frame clock | SNUADC sample clock | 18–52 ppm by setup | — | 32.3 ms | measured |
| 10 | Monitor output clock against SNUADC | Monitor analogue output clock | SNUADC sample clock | −25.4 to −28.7 ppm (6 cases) | — | — | estimated |
| 11 | Pacemaker against SNUADC | Pacemaker clock | SNUADC sample clock | — | — | — | measured |
| 12 | Solar8000 numerics against SNUADC | Solar8000 clock | SNUADC sample clock | 0 s/h median (p10–p90 about ±0.5 s/h) | — | — | measured |
Measurement space: two axes, two kinds of error
Every variable is described on two axes, time and value, and on each by its accuracy (how far the record is from the truth: bias, drift, delay, instrument error) and its resolution (how finely it was recorded: sampling, rounding, heaping). Each variable page draws the four together.
| Accuracy | Resolution | |
|---|---|---|
| Time | 11 clocks and 14 links between them; 8 variables with a written chain from UTC, 25 with timing against the working reference | the interval each value describes, the stamp grids (chart below) |
| Value | Not yet described for any variable: it needs the instruments’ calibration records (why) | 86 variables, 11 with fitted rounding models (Value) |
Every time stamp: accuracy and resolution
Each kind of time stamp in the dataset, placed by how far it lies after the end of the interval its value describes, against the working reference (across), and by how wide that interval is (up). Drawn from the atlas data each time the site is built, so it follows every update; the same data drives the synchronisation planner.
The working reference
The working reference is SNUADC stamp-model time: the SNUADC sample clock, placed on the recorder PC's timeline by the stamp model (drift and corrections fitted, the signal lost at each correction added back). Every delay in the planner is measured against it. Its own error against the PC is a few milliseconds where the SNUADC's corrections are seen; in recordings that make no SNUADC correction it rests on the port's typical rate and can drift by about ±0.1 s per hour (Long SNUADC recordings with no correction at all). The PC's error against UTC is assumed.
What synchronising the clocks does
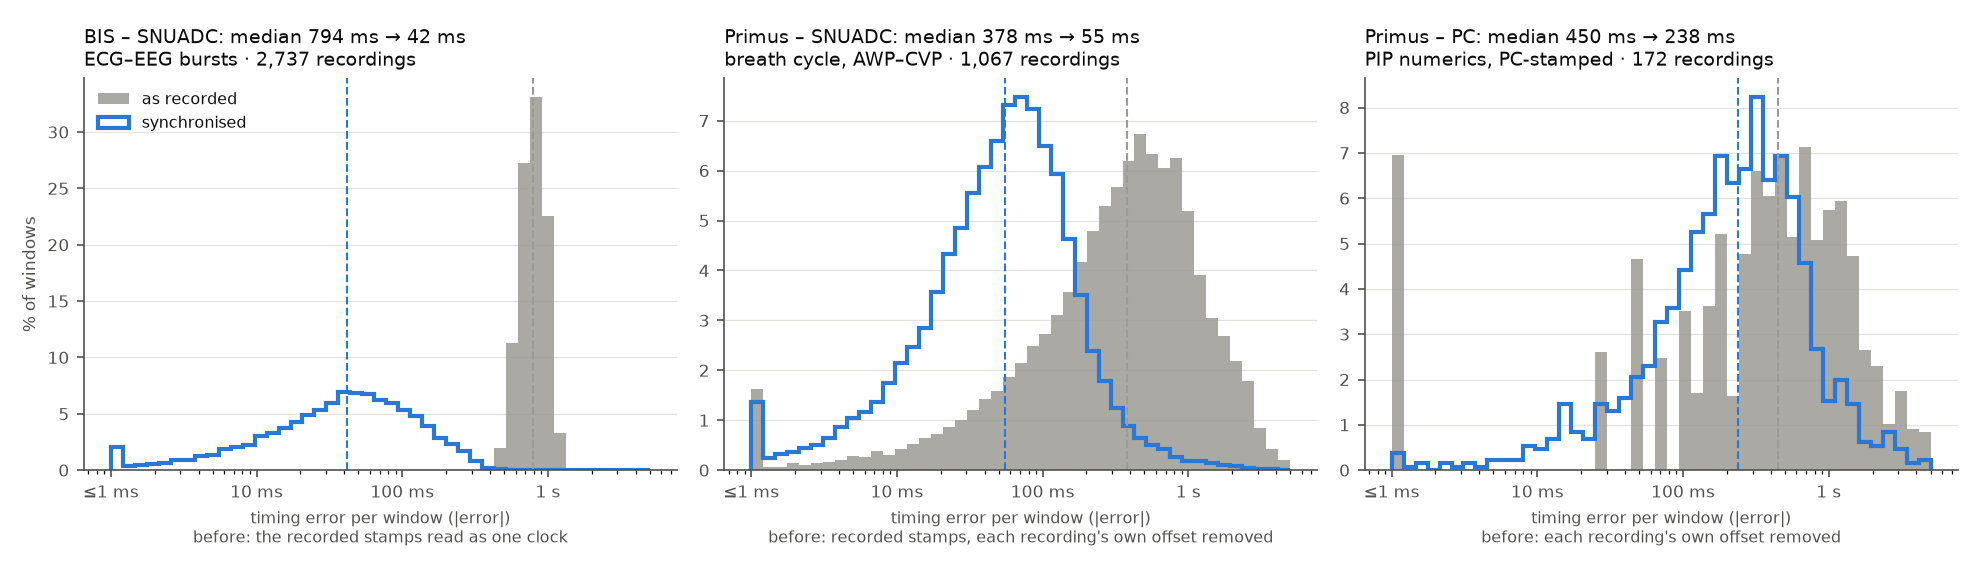
Across the whole release, for every link a shared signal can check:
Citing
If you use the atlas, please also cite the data:
- Lee H-C, Park Y, Yoon SB, Yang SM, Park D, Jung C-W. VitalDB, a high-fidelity multi-parameter vital signs database in surgical patients. Sci Data. 2022;9:279. doi:10.1038/s41597-022-01411-5
- Lee H-C, Jung C-W. VitalDB, a high-fidelity multi-parameter vital signs database in surgical patients (version 1.0.0). PhysioNet. 2022. doi:10.13026/czw8-9p62
- Pollard T, Moody BE, Lehman L, Gow B, Fernandes C, Xie C, Johnson A, Mark RG, Heldt T. PhysioNet as a global platform for biomedical research. Nature Health. 2026. doi:10.1038/s44360-026-00096-z
The data's licence, what the atlas contains and how the atlas may be reused are on Data and licence.
Key numbers
| Parameter | Value | Status | From |
|---|---|---|---|
| BIS drift against the recorder PC | 25 ppm (p10–p90 12 to 50; 5th–95th 7.3–51.1 ppm; census fit of 4,728 recordings median 21.1 ppm) | measured | The stamp sawtooth model for SNUADC and BIS |
| Solar8000 HR delay, late group | 4.2 s (± 0.65 SD; 64% of classified cases) | measured | Two heart-rate delay groups, one poll apart |
| PPG sawtooth rate | 18–52 ppm by setup | measured | The PPG sawtooth and its correction |
| Primus drift against the recorder PC, from breath matching | 104 ppm (p10–p90 28 to 184; 178 recordings; whole-recording lines give +87 ppm median in 1,060 (p10–p90 −49 to +229)) | measured | The Primus ventilator against SNUADC, by breaths |
| Signal lost at a SNUADC step-mode correction | 17.7 ms (range 17.2 to 18.2; n = 3; 3 corrections in 2 paced cases; ECG–EEG bursts give 13.0 ± 1.7 ms) | measured | Paced ECG as an independent clock |
| SNUADC step-mode correction interval | 2.08 h (5th–95th 1.65–3.57 h between resets; per-recording means p10–p90 1.68–3.07 h) | measured | The stamp sawtooth model for SNUADC and BIS |
| SNUADC step-mode drift | −63 ppm (p10–p90 −79 to −44; 5th–95th −80.3 to −36.9 ppm; medians of −46 to −74 ppm by serial port) | measured | The stamp sawtooth model for SNUADC and BIS |
| EEG–ECG timing error after the stamp model | 42 ms median, p90 150 ms (17 ms and 79 ms with the recording's own bursts) | measured | The stamp sawtooth model for SNUADC and BIS |
Plan a multi-signal analysis
The synchronisation planner takes the variables an analysis uses and reports how well their times line up, how we know, and what window sizes keep cross-modal features meaningful.
What is in the atlas
| Clocks | 11 | Anything that keeps time: a crystal, a computer clock, a frame clock, a pacemaker. |
| Devices | 14 | Hardware or software that produces signals. |
| Variables | 136 | Every recorded quantity: a waveform, a numeric, an event, a clinical field, a lab result. Each is described on two axes, time and value, each with its accuracy and its resolution. |
| Clock links | 14 | How one clock relates to another: drift and correction. Every rate is relative to against. |
| Parameters | 49 | One number the atlas relies on, with its uncertainty and where it came from. |
| Studies | 69 | One piece of work that produced insight: a mini report. |
| Observations | 54 | A general fact about the dataset's timing or recording, with its evidence and what it means. |
| Methods | 9 | A methodology group: studies that get at timing the same way. |
| Techniques | 12 | A reusable building block that studies share. |
| Worked examples | 14 | Common analyses worked through with and without the atlas's corrections, with code to reproduce them: where clock alignment or rounding changes the answer. |
| Software | 8 | The code behind the studies, importers and tools. Code paths in studies link into these repositories. |
The whole atlas is also one machine-readable file: vitaldb.metrology.json. Every number carries its status (measured, derived, estimated or assumed), its spread and the study it came from.