Height
Height (clinical table).
| Name in the dataset | height |
| Type | clinical |
| Stored in | clinical_data.csv |
| Unit | cm |
Measurement space
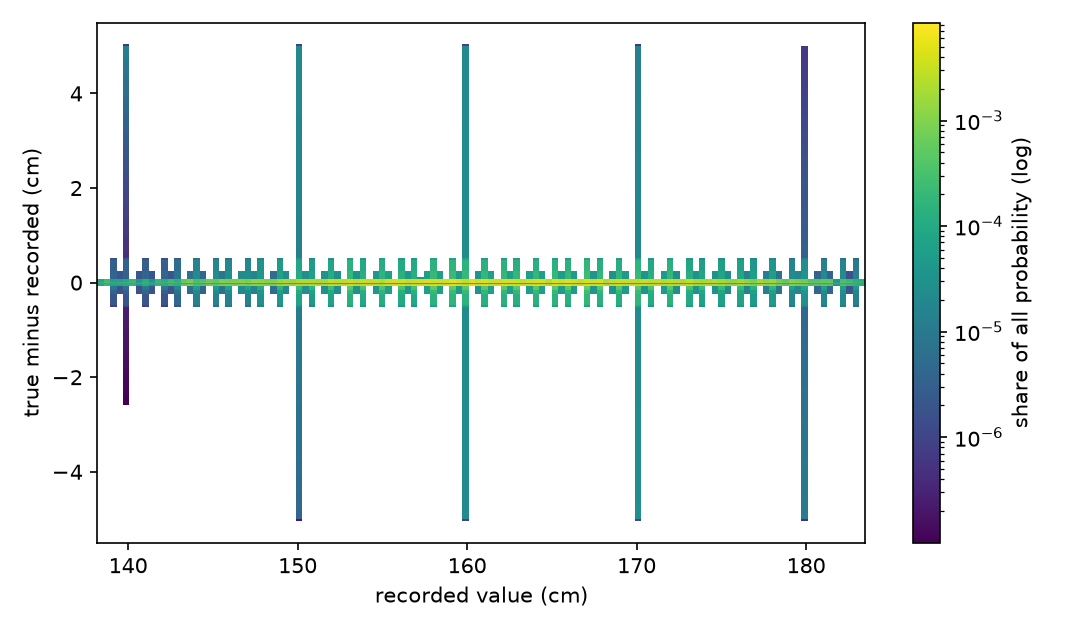
Vertical slices through the measurement space: how the true value is spread around a recorded one, for 4 recorded values chosen to show the different cases. Each panel has its own scale. Each is averaged over every record with that value in the release, from the pinned model; groups of fewer than 20 records are not shown.
- 160 cm (the commonest recorded value; 79 records): mean -0.0137 cm, SD 1.81 cm, 95% between -4.37 and +4.32. Rounding: tens 40%, measured_0.1 28%, whole_cm 22%.
- 159.3 cm (the narrowest; 34 records): mean +1.9e-06 cm, SD 0.0337 cm, 95% between -0.0871 and +0.0414. Rounding: measured_0.1 100%.
- 176 cm (unlike the others; 22 records): mean -0.0149 cm, SD 0.195 cm, 95% between -0.469 and +0.413. Rounding: whole_cm 43%, measured_0.1 42%, round_up_from_x9 8%.
- 171.5 cm (unlike the others; 24 records): mean -0.000472 cm, SD 0.0615 cm, 95% between -0.183 and +0.132. Rounding: measured_0.1 86%, half_cm 14%.
Time
This variable carries no time of its own in the dataset.
Value
| Model kind | model: fitted rounding model (value kind); posterior over the true value |
| Resolution | heaped: a mixture of rounding modes (see the value model) |
| Status | measured |
| Studies | Rounding and heaping of height |
In this release
How wide the true-value distribution is, record by record, over 6,388 of 6,388 records (all clinical rows) that have one. Computed with the pinned model, aggregates only.
| Median | p10 to p90 | |
|---|---|---|
| Standard deviation | 0.0289 cm | 0.0289 to 0.177 cm |
| 95% interval width | 0.095 cm | 0.095 to 0.853 cm |
| Mean minus recorded | -3.67e-05 cm | -0.00964 to 0.000251 cm |
Value model
Model file: …/models/height.model.json. Read from the pinned snapshot of vitaldb-resolution at commit bb03ddfc8a (2026-10-18).
How a true value becomes the recorded one. The rules are tried in order: a record not taken by an earlier rule is taken by this one with the probability shown (where its condition holds); the last rule takes the rest. Shares of all records depend on the conditions and the true value, so the model must be evaluated for them; the probabilities below are the fitted ones.
| Order | Rule | Rounds to | Probability if reached | Applies when |
|---|---|---|---|---|
| 1 | tens | 10 cm (nearest) | 1.3 % | always |
| 2 | whole_cm | 1 cm (nearest) | 6.4 % | varies with emop |
| 3 | half_cm | 0.5 cm (nearest) | 3.0 % | always |
| 4 | round_up_from_x9 | 1 cm (ceiling) | 19.4 % | recorded minus true in [0.05, 0.15) |
| 5 | measured_0.1 | 0.1 cm (nearest) | the rest | always |
| Recorded resolution | 0.1 |
| True-value density | normal_regression |
| Covariates | sex, age, emop |
| Fitted on | 6,041 records (clinical_data.csv) |
| BIC | 64,852 |
| Fitted | 2026-10-13 |
- Rounding model kept at the native 0.1 cm so that the decimal digit can separate measured from written-in heights; diurnal height change is handled by measurement_variability, not by coarsening.
- Measurement variability (beyond rounding): SD 0.5 cm; for written-in values, SD 2.6 cm (from literature, not fitted).
Sources the model cites:
- Leatt P, Reilly T, Troup JG. Spinal loading during circuit weight-training and running. Br J Sports Med. 1986;20(3):119-124. doi:10.1136/bjsm.20.3.119
- Healey EL, Burden AM, McEwan IM, Fowler NE. Diurnal variation in stature: do those with chronic low-back pain differ from asymptomatic controls? Clin Biomech. 2011;26(4):331-336. doi:10.1016/j.clinbiomech.2010.11.017
- Voss LD, Bailey BJR. Diurnal variation in stature: is stretching the answer? Arch Dis Child. 1997;77(4):319-322. doi:10.1136/adc.77.4.319
- Ko Y, Choi S, Won J, Lee YK, Kim DH, Lee SK. Differences in accuracy of height, weight, and body mass index between self-reported and measured using the 2018 Korea Community Health Survey data. Epidemiol Health. 2022;44:e2022024. doi:10.4178/epih.e2022024
Studies
| Study | Date | Status | Summary |
|---|---|---|---|
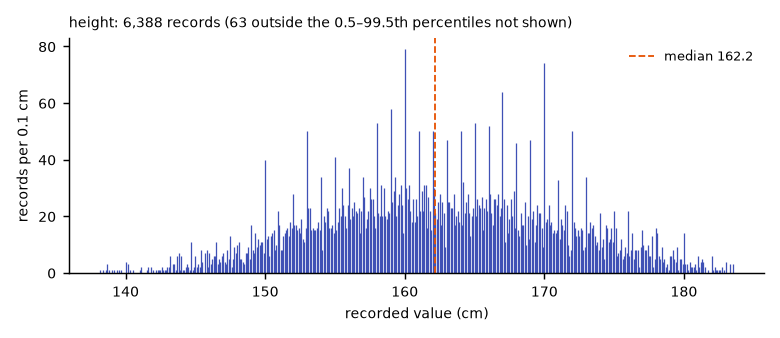
| Rounding and heaping of height | 2026-10-13 | current | Recorded height is a mixture of 5 rounding modes (tens, whole_cm, half_cm, round_up_from_x9, measured_0.1); the model gives the true value's distribution for each record. |
Figures
Tags: generated, vitaldb-resolution