Draft
Worked through on a few cases; numbers may change.
Oliguria labels for a prediction model
One label per patient, oliguric or not, from three rounded numbers: 10% of labels are uncertain and 2.6% are expected to be wrong, which sets a floor under the error any model can be measured to have. A typical model is barely affected; a good one is.
The question
If a prediction model is trained and scored on "oliguric during the operation: yes or no", how good are those labels, and what do they do to the model's measured performance?
Inputs
Each input links to its measurement page: how it is timed, how its value was recorded, and how uncertain both are.
| Input | Unit | What it is |
|---|---|---|
| Intraoperative urine output | mL | Intraoperative urine output (clinical table). |
| Weight | kg | Weight (clinical table). |
| Anaesthesia duration | min | Anaesthesia duration (derived table). |
Why the atlas changes the answer
A model is trained and scored one patient at a time, so it meets each label's rounding unaveraged. The oliguria label is a threshold (0.5 mL/kg/h) on a ratio of three rounded numbers (Urine output in mL/kg/h as a distribution): where the recorded numbers fall near the threshold, the true rate may lie on the other side. Across a cohort these errors cancel (A regression that carries rounding uncertainty through); in a per-patient label they do not.
Data
The 3,645 cases with a positive urine output, a weight and both anaesthesia times; 1,276 (35%) are oliguric by the recorded numbers.
Steps
- For each case, draw 200 true rates from the vitaldb-resolution library (v0.6.0) and take P(oliguric), the share of draws below 0.5 mL/kg/h. A label is uncertain when 0.05 < P < 0.95; the expected number of wrong recorded labels is the sum over cases of P(the true label differs from the recorded one).
- The floor. Use the true rate itself as a "model", with increasing noise added on the log scale, and score it both against the true labels (from the same draw) and against the recorded labels.
- A real model. A logistic regression on preoperative and case-type variables (age, height, BMI, ASA, emergency, laboratory values, department, approach, anaesthesia and operation type), 5-fold cross-validated, trained on the recorded labels (hard) or on P(oliguric) (soft labels), and scored against both kinds of label.
Results
The labels. 370 of the 3,645 labels (10%) are uncertain, and 96 (2.6%) are expected to be wrong. They are concentrated in cases whose urine output was written as a round 50 or 100 mL (200 mL or less): 30% uncertain, against 3% of other cases.
A floor under the error. A model that knew each patient's true rate exactly would be "wrong" on 2.6% of recorded labels (AUC 0.996 rather than 1). Below an error rate of about 10% against the true labels, the recorded labels add a visible share of the measured error: a model 98.3% right is scored 96.7%, one 96.4% right is scored 95.3%. Above that the labels' own error is lost in the model's.
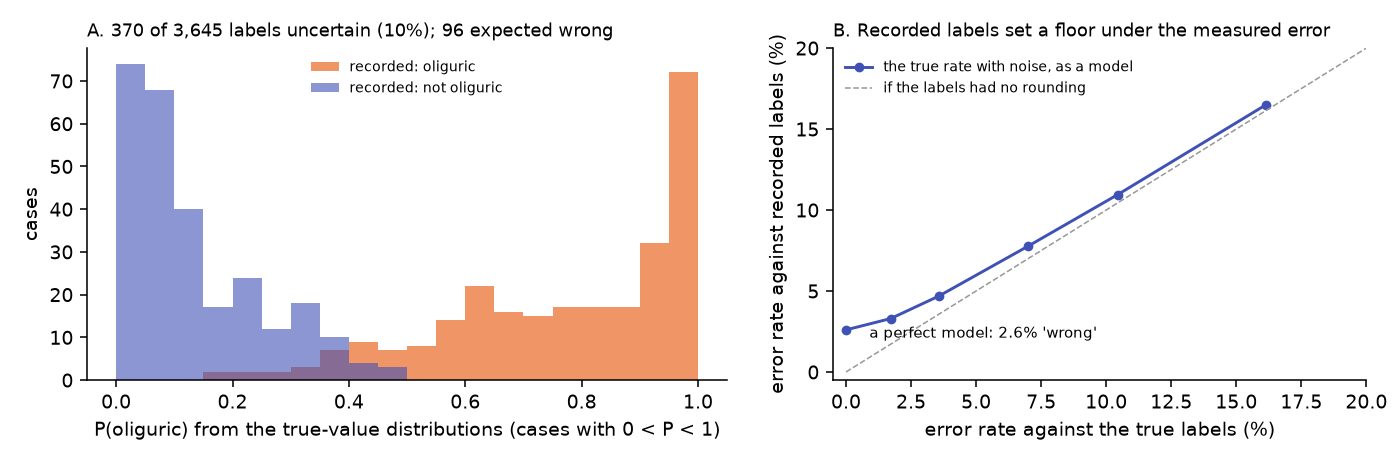
A typical model is barely affected. The preoperative model reaches AUC 0.658 against the recorded labels and 0.659 against the true labels (0.653 to 0.664 over draws). The spread from the labels (SD 0.003) is a third of the spread from which patients happen to be in the sample (bootstrap SD 0.010). Training on soft labels changes the AUC by less than 0.001. Dropping the uncertain cases from the test set, a common way of "cleaning" labels, raises the AUC to 0.678: not because the labels are better, but because the cases near the threshold, which are hard for any model, are gone.
Population and individual
Random: cancels over a cohort.
| The cohort | A typical model's AUC moves by less than 0.001; the labels add a third of the sampling noise. |
| Each patient | 10% of labels are uncertain and 2.6% are expected wrong, a floor under the error any model can be measured to have. |
Takeaways
- Report how many labels are uncertain, and P(label) for each case, alongside a labelled dataset.
- The labels set a floor under the measurable error. It matters for good models, and for comparing models that differ by a few points; it does not matter for a model as weak as this one.
- Do not drop uncertain cases from a test set: it flatters the model. Score against the draws instead, or weight each case by P.
Limitations
- The inputs are drawn independently, and the library models only rounding; any systematic error in charted urine output (a bag emptied late, a missed volume) is not included and would not cancel.
- The preoperative model is a stand-in for any model; better models feel the floor more.
Studies it relies on
| Study | Date | Status | Summary |
|---|---|---|---|
| Rounding and heaping of intraoperative urine output | 2026-10-18 | current | Recorded intraoperative urine output is a mixture of 4 rounding modes (100 mL, 50 mL, 10 mL, 5 mL (base)); the model gives the true value's distribution for each record. |
| How the anesthesia start time was charted | 2026-10-18 | current | The charted anesthesia start time is a mixture of 5 ways of writing a clock time (nominal_0740, nominal_0730, nearest_10min, nearest_5min, clock_minute), modelled as an offset from a device time. |
| How the anesthesia end time was charted | 2026-10-18 | current | The charted anesthesia end time is a mixture of 4 ways of writing a clock time (ceiling_30min, ceiling_10min, ceiling_5min, clock_minute), modelled as an offset from a device time. |
| Rounding and heaping of weight | 2026-10-13 | current | Recorded weight is a mixture of 3 rounding modes (whole_kg, scale_0.1, scale_0.05); the model gives the true value's distribution for each record. |
| Bias in charted intervals | 2026-10-13 | current | Charted intervals are biased because each end is rounded with a different anchor, and their per-case uncertainty is large relative to short intervals. |
Reproduce it
python examples/oliguria_labels.py --resolution <vitaldb-resolution at the pinned commit> \
    --root <VitalDB release> --out out/oliguria --draws 200