Draft
Worked through on a few cases; numbers may change.
Pulse arrival time against blood pressure, before and after synchronisation
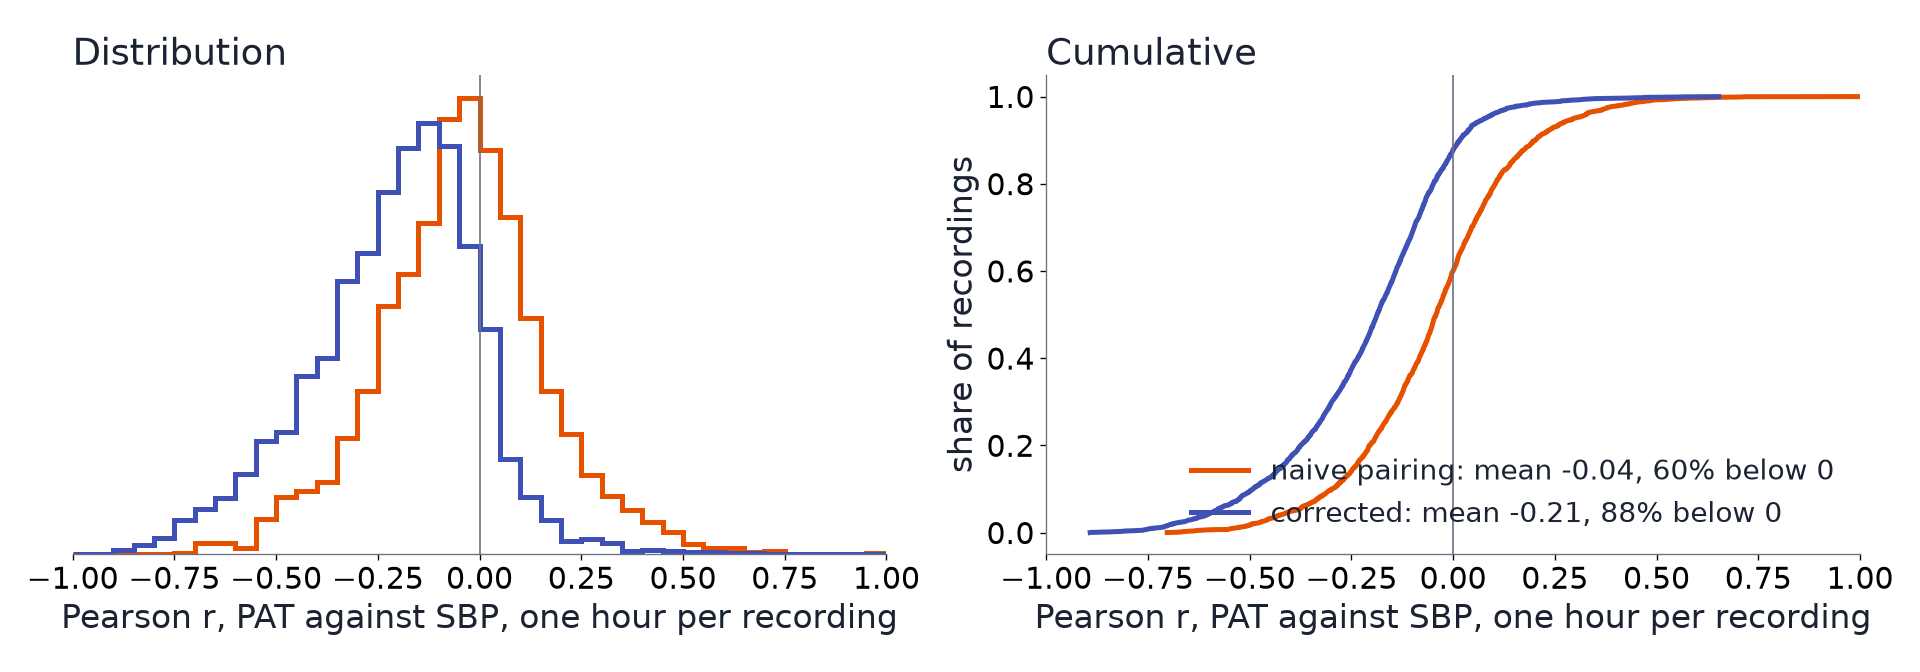
In 3,270 recordings, PAT tracks systolic pressure only once each pulse is paired with its own beat: the hourly correlation moves from a mean of −0.04 to −0.21 (88% of recordings negative), reproducing Ruffolo et al. 2025 in a second dataset; paired naively, PAT is a heart-rate signal.
The question
Does pulse arrival time (PAT) follow blood pressure within a patient, and how much of the answer depends on synchronising the ECG and the finger pulse correctly?
Inputs
Each input links to its measurement page: how it is timed, how its value was recorded, and how uncertain both are.
| Input | Unit | What it is |
|---|---|---|
| ECG lead II (SNUADC) | mV | Lead II of the ECG, sampled by SNUADC at 500 Hz from the monitor's analogue output. |
| Plethysmogram (SNUADC) | The pulse oximeter's plethysmogram, sampled by SNUADC at 500 Hz. It reaches SNUADC through the oximeter's own 30 Hz frame clock and a hardware delay of about 0.4 s. | |
| Arterial pressure (SNUADC) | mmHg | Invasive arterial pressure, sampled by SNUADC at 500 Hz from the monitor's analogue output. |
| Solar8000 ART and CVP numerics | mmHg | Arterial and central venous pressure values from the Solar8000 monitor. |
Why the atlas changes the answer
PAT is studied as a cuffless blood-pressure surrogate, with mixed results. In VitalDB the stored ECG-to-PLETH delay is about 0.7 s (One device delay for the PLETH across the release), longer than one RR interval at faster heart rates, so pairing each pulse with the next R peak puts it one beat out; and the PLETH reaches the recorder on the oximeter's 30 Hz frames, with a sawtooth of 33 ms slips (The PPG sawtooth and its correction). Ruffolo et al. found in a paediatric ICU that the expected negative PAT–SBP correlation only appears after correcting such errors (Ruffolo et al. 2025, appendix B), and suspected naive synchronisation makes PAT follow heart rate instead. This example tests both in VitalDB.
Data
Every recording with SNUADC ECG II, PLETH and a pulsatile arterial line at 500 Hz, and some variation in systolic pressure (SD of 3 mmHg or more): 3,270 recordings, 60 minutes each from 10 minutes into the overlap (as Pulse arrival time in two correction steps). All three signals are on one clock, the SNUADC's.
Steps
- R peaks in ECG II; per beat, systolic pressure (the arterial peak after its upstroke), mean pressure (foot to foot) and heart rate (the RR interval ending at the beat).
- PAT, R peak to the steepest PLETH upstroke, under five timings: naive, each R peak paired with the first upstroke 0.1 s or more after it; own beat, the upstroke within 0.25 s of the recording's typical delay; + sawtooth removed, step 1 of Pulse arrival time in two correction steps; + global delay, step 2, a constant, so every correlation must equal the previous one (a built-in check); and arterial PAT, R peak to the arterial upstroke, with neither problem, as the reference.
- Pearson r per recording between PAT and SBP, MAP and heart rate, and between PAT and SBP with heart rate held constant (partial r): beat to beat, and over 30 s windows (window medians).
- As Ruffolo et al. appendix B: the mean of the beat-paired, hour-long r and the share of recordings with r below 0.
Results
The appendix B result, reproduced.
| PAT against SBP, r over one hour per patient | Ruffolo et al. 2025 (paediatric ICU, 3,316 patients) | VitalDB (adult surgery, 3,270 recordings) |
|---|---|---|
| Naive synchronisation | Centred on 0; about 50% below 0 | Mean −0.04; 60% below 0 |
| Corrected | Mean −0.16; 84% below 0 | Mean −0.21; 88% below 0 |
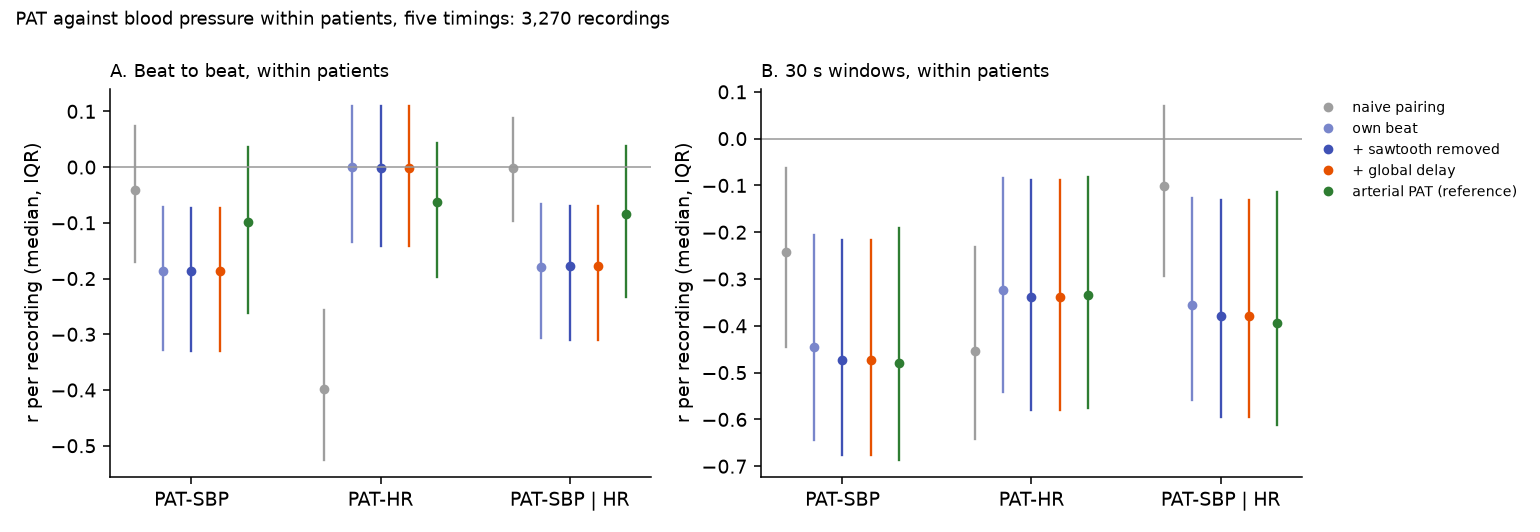
Paired naively, PAT is a heart-rate signal. Beat to beat, naive PAT correlates with heart rate (median r −0.40) and hardly with SBP (−0.04); with heart rate held constant, nothing is left (−0.00). Paired with its own beat, PAT does not follow heart rate (0.00) and does follow SBP (−0.19; −0.18 with heart rate held constant). In the 523 recordings where naive pairing is one beat out more than a fifth of the time, the same holds more strongly (PAT–HR −0.36 naive, 0.01 paired). This confirms Ruffolo et al.'s suspicion that naive synchronisation makes PAT track heart rate.
Over 30 s windows the link is stronger, and the corrected finger PAT matches the arterial PAT:
| Median r per recording, 30 s windows | PAT–SBP | PAT–HR | PAT–SBP, HR held constant |
|---|---|---|---|
| Naive pairing | −0.24 | −0.45 | −0.10 |
| Own beat | −0.45 | −0.32 | −0.36 |
| + sawtooth removed | −0.47 | −0.34 | −0.38 |
| + global delay | −0.47 | −0.34 | −0.38 |
| Arterial PAT (reference) | −0.48 | −0.34 | −0.39 |
Almost all of the gain comes from the pairing; removing the sawtooth adds a little over windows (−0.45 to −0.47) and nothing beat to beat, where its 33 ms slips are small next to beat-to-beat noise. The global delay changes nothing, as it must. The slope is −0.41 ms of PAT per mmHg of SBP (median over recordings), against −0.34 for the arterial PAT.
Between patients, PAT says little about SBP. Naive PAT's recording medians correlate with heart rate (r −0.69) and slightly positively with SBP (+0.08); correctly paired, both are near zero (−0.15 and −0.05). The device delay is the same for every recording, so it neither helps nor hurts between patients.
Population and individual
Systematic: does not cancel.
| The cohort | Naive pairing turns a cohort's mean hourly PAT–SBP correlation from −0.21 into −0.04, and its PAT–HR correlation into −0.40: a systematic error that changes what a study concludes. |
| Each patient | Each recording's correlation moves by a median −0.16 when pulses are paired with their own beats; for a patient-level PAT–BP calibration, the pairing decides whether there is a signal at all. |
Takeaways
- Pair each pulse with its own beat before using PAT for anything: in VitalDB the stored delay is longer than the RR interval at ordinary heart rates, and naive pairing makes PAT a heart-rate signal.
- Test PAT against BP with heart rate held constant; otherwise a correlation may be heart rate's.
- Over 30 s windows, corrected finger PAT carries as much SBP information as arterial PAT; beat to beat, neither carries much.
- The result holds in two very different populations (paediatric ICU, adult surgery) with different monitors.
Limitations
- Pearson r over an hour mixes slow trends with beat-to-beat noise; the 30 s scale is more informative, but its windows are not independent.
- SBP comes from the same arterial line whose upstroke gives the reference PAT, so the reference is not independent of the BP measurement.
- The "own beat" window is centred on each recording's typical delay; a recording whose delay changes by more than 0.25 s would be paired wrongly.
- Ruffolo et al. corrected with their full method (including maximum-likelihood smoothing); here "corrected" is own-beat pairing plus sawtooth removal, so the comparison is of methods in spirit, not identical steps.
Studies it relies on
| Study | Date | Status | Summary |
|---|---|---|---|
| One device delay for the PLETH across the release | 2026-10-18 | current | The stored ECG-to-PLETH delay was measured in 5,536 recordings, to the foot and to the steepest upstroke of each pulse. It has one peak (655 ms to the foot, 715 ms to the upstroke, in the median recording), no clusters by recording setup or SNUADC port, and no shift along the case order: one global device delay, 385 ms with an adopted R-to-foot finger PAT of 270 ms, fits the whole release, as Ruffolo et al. found in their own data. |
| The PPG hardware delay and the adopted pulse arrival time | 2026-10-12 | current | VitalDB's raw ECG→PPG pulse arrival time is about 0.4 s longer than physiology. Splitting it into a hardware delay (one value for the release; One device delay for the PLETH across the release) and a physiological part needs an adopted value from studies that sampled ECG and PPG on one clock: about 270 ms for anaesthetised adults. |
| Arterial pressure as a check on the PPG correction | 2026-10-11 | current | Arterial pressure is sampled by the same converter but has no frame and no sawtooth, so every PPG slip leaves ECG→ABP unchanged. Against it, detected slips are 97–100% real and tier A leaves about 2 ms of drift mid-tooth. |
| The PPG sawtooth and its correction | 2026-10-10 | current | The ECG→PPG delay creeps at 18–52 ppm and jumps up by one 33.3 ms frame at each slip, every 11–31 minutes. A tooth-by-tooth model removes it; where the correction is confident it is essentially exact on injected test data. |
Observations it relies on
| Observation | Status | Summary |
|---|---|---|
| Every time is quantised, and fiducials inherit it | established | A time on a grid of step Δ carries an error of Δ/√12 (1 SD). In VitalDB that is 0.58 ms for a 500 Hz sample, 2.3 ms for BIS EEG, 0.8 ms for the arrhythmia annotations' 1/360 s grid, and up to ±17 ms for PPG fiducials taken on raw samples, which lock to the 33.3 ms frame. |
Reproduce it
- vitaldb-bench:
examples/pat_vs_bp.py,examples/pulse_arrival_time.py,examples/run_scan.sh,tools/deck_figures.py
bash examples/run_scan.sh pat_vs_bp                    # 8 parallel parts, about 15 minutes
python examples/pat_vs_bp.py agg <work>/examples/pat_vs_bp/part_*.jsonl --out out/pat_bp
References
- Ruffolo I, Siddiqui A, Nguyen B, Dixon W, Assadi A, Greer R, Schwartz S, Brudno M, Mariakakis A, Goodwin A. High-fidelity measurement of pulse arrival time in critically ill children using standard bedside monitoring equipment. Physiol Meas. 2025;46(11):115006. ↗