Body mass index, derived from its inputs
Body mass index computed from the posteriors of height, weight.
| Date | 2026-10-18 |
| Status | current |
| Methods | Rounding, heaping and value resolution |
| Variables | Body mass index |
Background
- BMI is computed, not entered. Every one of the 6,388 recorded values equals weight ÷ (height/100)² rounded to 0.1.
- So it has no rounding behaviour of its own, and the recorded value says nothing about true height and weight beyond those two fields.
Data
- All 6,388 recorded BMI values, recomputed from height and weight as a check.
- Inputs come from
height.model.jsonandweight.model.json.
Method
- No rounding model. BMI is a derived variable (
kind: derived, evaluated byderived_samples). - For each case, height and weight are drawn from their own posteriors (sex, age, emergency status, department), optionally with measurement variability, and BMI is computed per draw.
- The recorded BMI is kept only as a consistency check.
Results
- With measured inputs, BMI is known to about ±0.02 from the recording alone; measurement variability widens that to about ±0.4.
- A possibly written-in 160.0 cm height can come from the nearest-10 cm mode, so BMI spreads from 22.5 to 24.8 (95%).
- With variability, the self-report bias for older women (heights over-reported by about 1.3 cm at 60–69) moves the centre up to about 23.9 and widens the interval to 22.0–26.3.
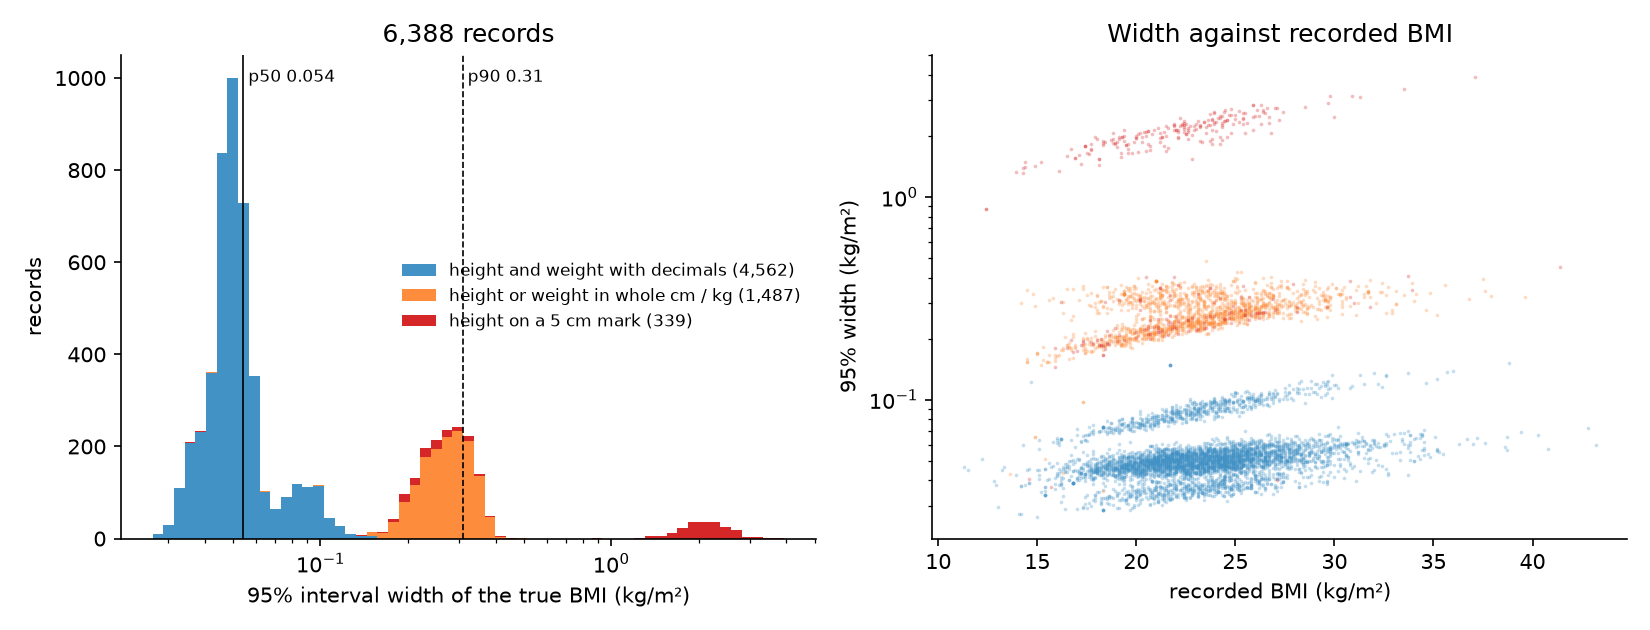
- Over the whole release (6,388 records, the library's default call: rounding only, no measurement variability), the median 95% width of the true BMI is 0.054 kg/m² and the 90th centile 0.31. The widths fall into three groups set by how height and weight were written: both with decimals (4,562 records, median 0.050), height or weight in whole cm or kg (1,487, median 0.27), and heights on a 5 cm mark (339, median 1.8). The widest 210 records all have such a height, consistent with the model reading them as possibly written in.
Discussion
- The API returns BMI as a distribution built from the height and weight distributions for the same case, not from the recorded BMI.
- The same approach is planned for eGFR, ICU days and length of stay.
Limitations
- Height and weight are drawn independently given sex and age, so their correlation is ignored. This matters only when an input posterior is wide.
Model
Model file: …/models/bmi.model.json. Read from the pinned snapshot of vitaldb-resolution at commit bb03ddfc8a (2026-10-18).
| Recorded resolution | 0.1 (nearest), as stored |
| Covariates | sex, age, emop, department |
- Derived: weight / (height/100)^2
Code
Figures
Tags: generated, vitaldb-resolution