Draft
Worked through on a few cases; numbers may change.
End-tidal to arterial CO₂, and pulse oximetry against blood gas, at the right moment
For 4,281 blood gases, reading the monitor when the blood was drawn rather than at the lab stamp makes changes in end-tidal CO₂ track changes in arterial CO₂ far better (within-patient correlation 0.74 against 0.54), and agreement peaks exactly at the estimated draw. Oximetry shows the same timing (agreement peaks at the draw), but the 100% ceiling hides the size of the oximetry gradient for three gases in four.
The question
How far apart are end-tidal and arterial CO₂, and SpO₂ and SaO₂, when they are compared at the same moment, and how precisely does the release say?
Inputs
Each input links to its measurement page: how it is timed, how its value was recorded, and how uncertain both are.
| Input | Unit | What it is |
|---|---|---|
| Partial pressure of CO₂ | mmHg | partial pressure of CO₂ (lab table). |
| Arterial oxygen saturation | % | Arterial oxygen saturation (lab table). |
| Blood gas result time | Time stamp of a blood gas result in the lab table. | |
| Primus ETCO₂, PIP and RR | End-tidal CO₂, peak pressure and respiratory rate from the Primus, polled about every 7 s. | |
| SpO₂ | % | Oxygen saturation from the pulse oximeter. |
| Arterial pressure (SNUADC) | mmHg | Invasive arterial pressure, sampled by SNUADC at 500 Hz from the monitor's analogue output. |
Why the atlas changes the answer
A blood-gas result's timestamp is 3–12 minutes after the draw (The lab time is neither the draw nor the result). Comparing it with the monitor value at the timestamp compares two different moments; during a change in ventilation that adds spread, and sometimes bias, to the gradient. On the value side, every term is a whole number, and both SpO₂ and SaO₂ stop at 100%. The SpO₂–SaO₂ comparison follows Eytan et al. 2019, which compared bedside oximetry with arterial blood gases in critically ill children.
Data
Blood gases matched to exactly one arterial-line access in the 15 minutes before their lab stamp
(lab_draw:single in Arterial line accesses in the pressure waveform): 4,281 gases in 1,349 cases, each with Primus end-tidal
CO₂ and Solar8000 SpO₂ in the recording. Gases with several candidate accesses (459) are left out.
Steps
- Take the start of the matched arterial-line access as the draw. The monitor value is the median of its readings over ±60 s of that moment.
- Draw 400 Monte Carlo samples per gas of:
- the draw time, uniform over the access (median 42 s long), plus the monitor's stamping delay (a numeric describes a window that ended 1–9 s before its stamp; Monitor numerics describe the past, never the future);
- each monitor reading's true value, uniform over ±0.5 of the whole number written; an SpO₂ of 100 is censored, so its true value is anywhere from 99.5 to 100;
- the lab value, from the pinned vitaldb-resolution library (v0.6.0), with SaO₂ capped at 100.
- Summarise each gradient by its median and 95% interval. Repeat with the draw time fixed (rounding only), and with the single reading nearest the draw instead of the ±60 s median.
- Compare the point gradient with the monitor read at the draw and at the lab stamp.
- Test the timing within patients. Between consecutive gases of the same patient, correlate the change in PaCO₂ with the change in EtCO₂, read at the draw and at the lab stamp (95% intervals by resampling patients). Between-patient differences in the gradient (set by each patient's dead space) cancel in a change, so this tests timing, not physiology.
- Timing scan. Repeat step 5 with the monitor read at every whole minute from 10 minutes before the start of the access to 15 minutes after it. If the draw estimate is right, agreement should peak at 0, not at the lab stamp. For oximetry, gases are chosen by the lab value (SaO₂ ≤ 98%, below the analyser's ceiling), never by the monitor reading, so no offset is favoured, and a rank correlation is used, which treats SpO₂ = 100 as a tie.
Results
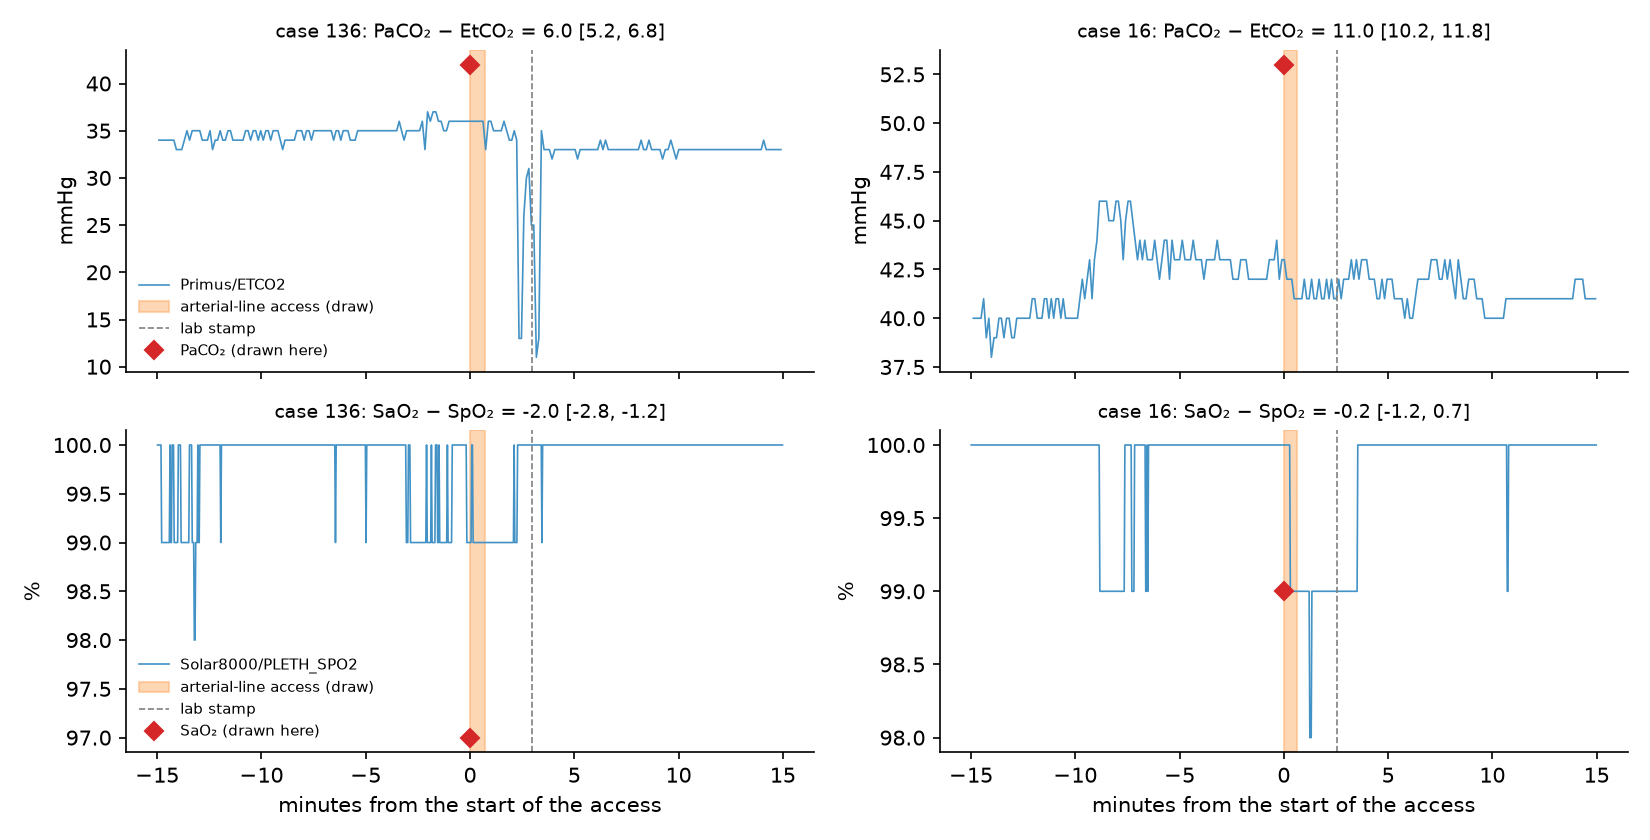
Two gases. In case 136 end-tidal CO₂ falls sharply about 2½ minutes after the draw, just before the lab stamp. Read at the draw, PaCO₂ − EtCO₂ is 6.0 mmHg (95% interval 5.2–6.8); read at the stamp it would be 11. In case 16 the CO₂ gradient is the same either way (11 mmHg), but SpO₂ is 100 at the draw: with SaO₂ at 99, the oximetry gradient runs from −1.2 to +0.7, and its sign is not known.
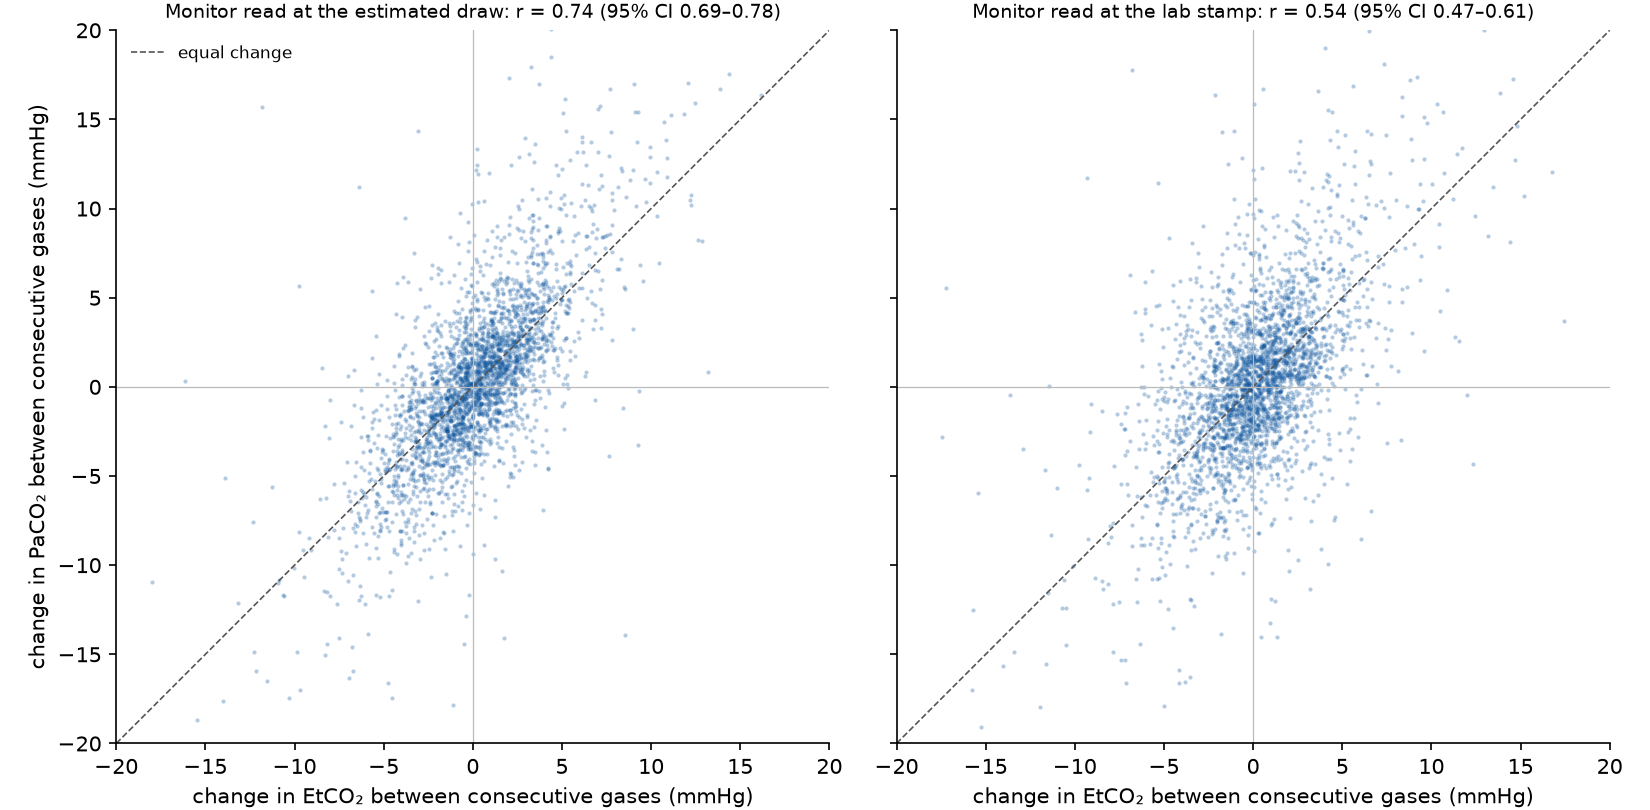
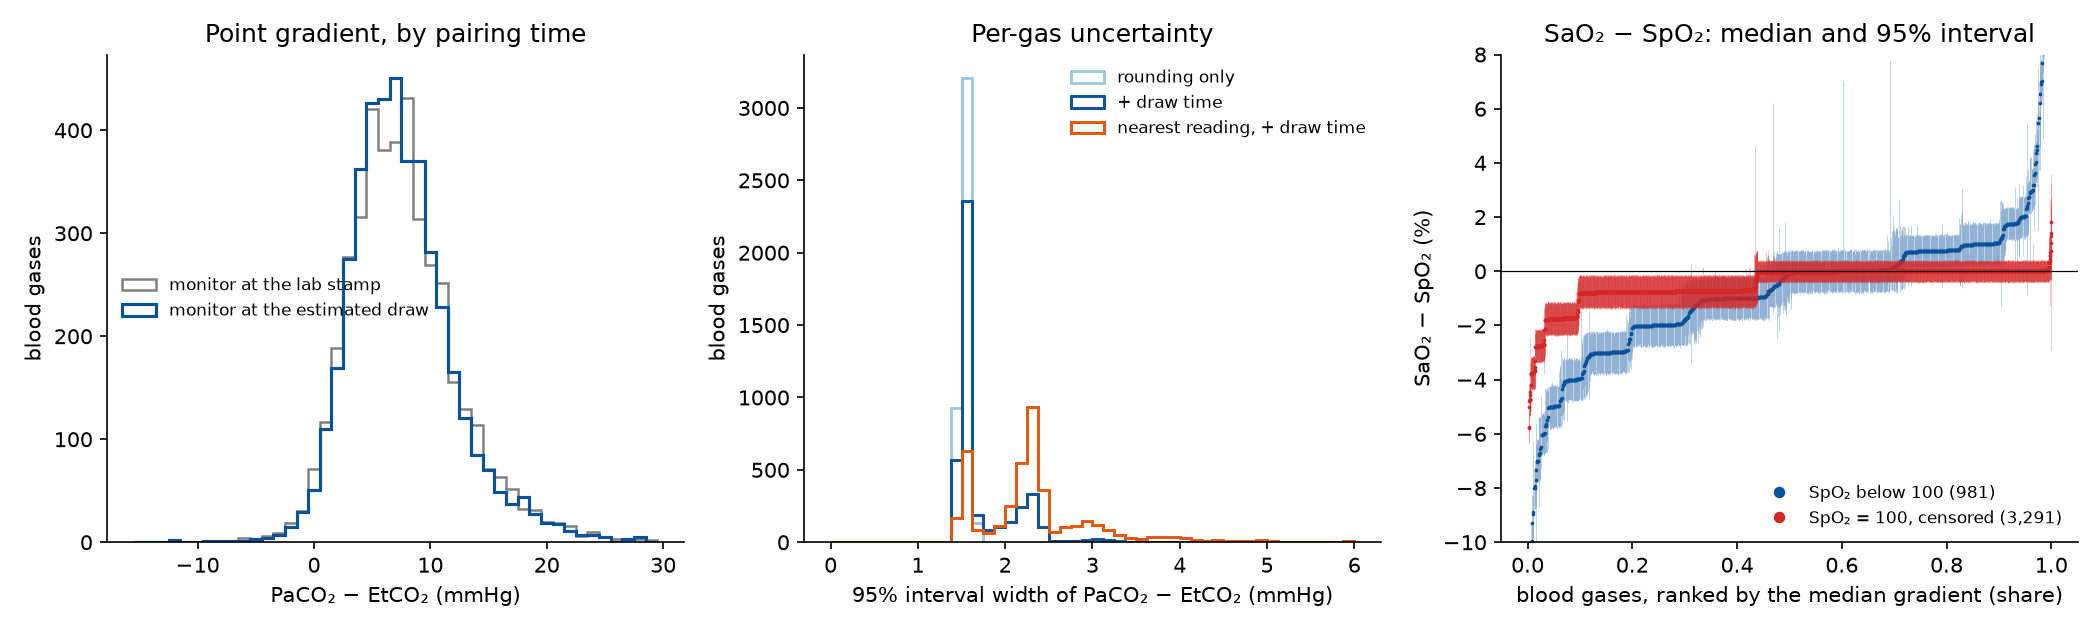
Does the draw time matter? Yes, within patients. Between consecutive gases of the same patient (2,911 pairs), the change in PaCO₂ follows the change in EtCO₂ with a correlation of 0.74 (95% interval 0.69–0.78) when the monitor is read at the estimated draw, against 0.54 (0.47–0.61) at the lab stamp. Read minutes late, the monitor misses what happened between the draw and the stamp.
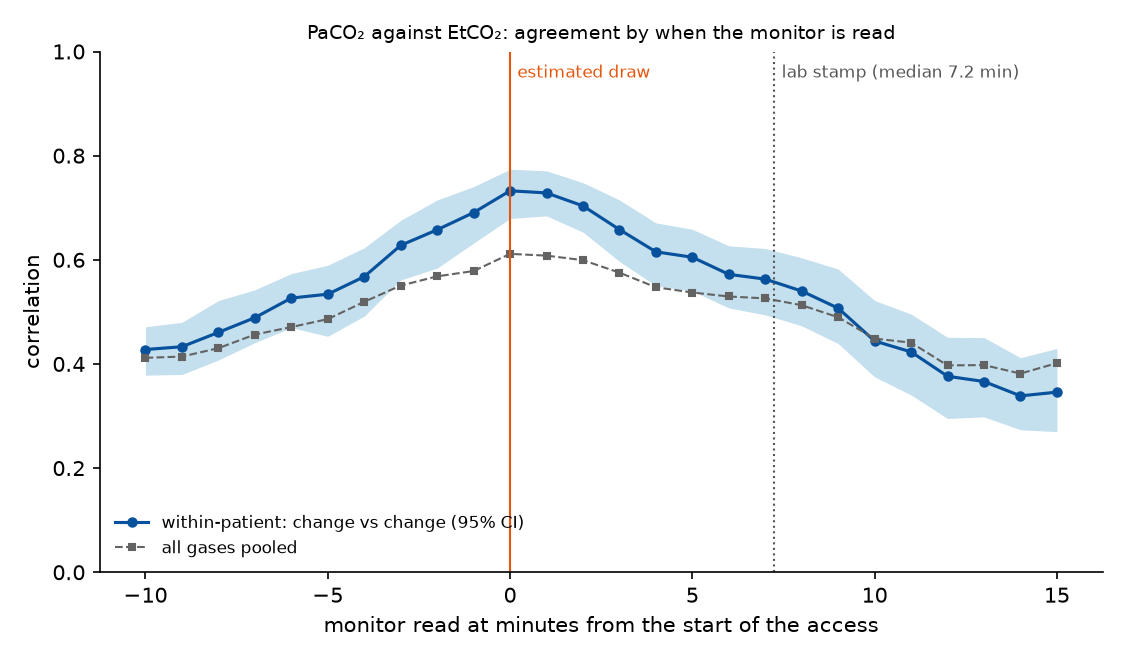
Agreement peaks at the estimated draw. Read at each minute from 10 minutes before the access to 15 minutes after, the within-patient correlation is highest at 0 (0.73) and falls off on both sides; at the median lab stamp (7.2 minutes) it is 0.56. This is independent support for the draw estimate: nothing in the method forces the peak to land at the access.
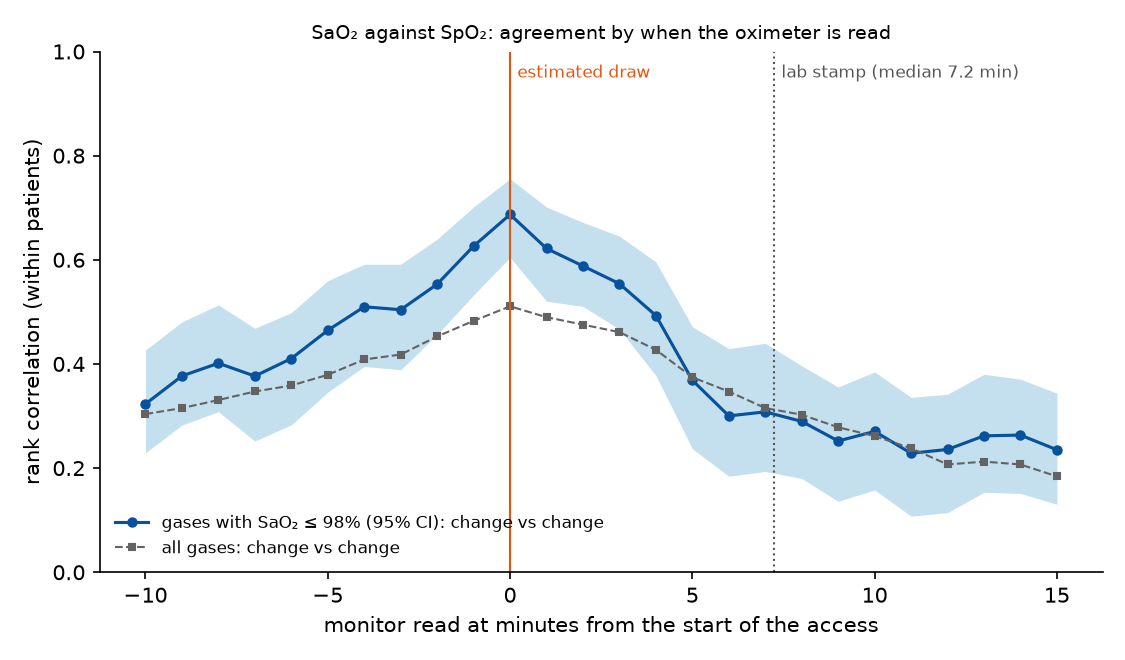
Oximetry shows the same timing. In gases with SaO₂ ≤ 98% (881 gases, 379 within-patient pairs), the rank correlation of changes in SaO₂ and SpO₂ peaks at the estimated draw (0.69) and falls to 0.34 at the lab stamp; the 95% intervals at the two moments do not overlap. Over all gases, with SpO₂ = 100 as ties, the peak is also at the draw (0.51, against 0.32 at the stamp).
PaCO₂ − EtCO₂ across patients. Median 7 mmHg (interquartile range 5–10; 5th–95th percentile 1–16). Pooled over patients the two agree only moderately (correlation 0.61 at the draw, 0.50 at the stamp), because each patient has their own gradient: the patients' typical gradients spread with an SD of about 4.1 mmHg, while one patient's gradient varies by about 1.5 mmHg. Pooled, reading at the stamp instead of the draw barely changes the distribution, though it moves an individual gas's gradient by 3 mmHg or more in 11.5% of gases.
How precisely each gradient is known. Per gas, the median 95% interval is 1.57 mmHg wide; rounding alone gives 1.54, so the uncertain draw time adds almost nothing once the monitor is averaged over ±60 s. Using the single nearest reading instead widens it to 2.29 mmHg (up to 4.3 at the 95th percentile). This is the precision of the recording, not agreement between the two measurements.
SaO₂ − SpO₂. Median 0 (interquartile range −0.8 to 0). SpO₂ is 100 at the draw for 77% of gases and SaO₂ is 100 for 47%. With SpO₂ = 100 read as "99.5 to 100", the interval includes zero for half of all gases: the release can say that the two agree to within a percentage point, but not which way they differ. Where SpO₂ is below 100 (about 980 gases) the sign is mostly resolved: SpO₂ is clearly above SaO₂ in 45% of them and clearly below in 26%.
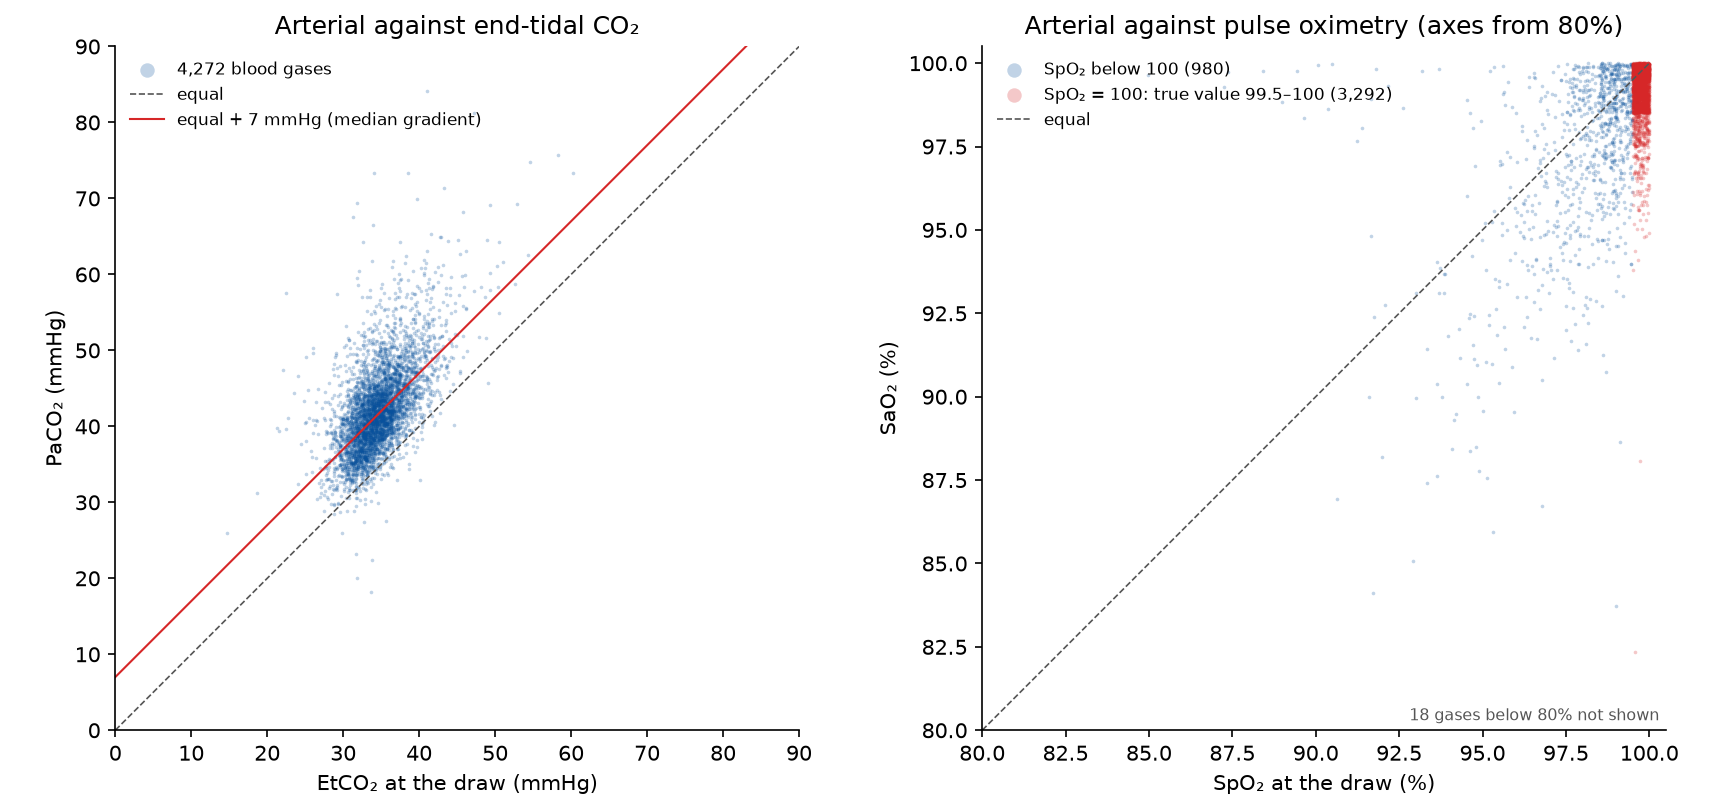
Each gas as a point. Pooled over patients, arterial CO₂ follows end-tidal CO₂ only moderately (correlation 0.61), sitting about 7 mmHg above it; the spread is mostly between patients (see above). For oxygen, three gases in four are in the column at SpO₂ = 100, where the oximeter cannot say how high the saturation really is; SaO₂ in that column runs from about 95 to 100. Where SpO₂ is below 100, SaO₂ still reads 100 in 17% of gases, a pattern that would fit an analyser that calculates SaO₂ from PO₂ (see the open questions).
Population and individual
Systematic: does not cancel.
| The cohort | Pooled over patients, reading the monitor at the lab stamp instead of the draw changes the gradient's distribution little. |
| Each patient | Within a patient, the stamp is always about 7 minutes late, a systematic shift: the monitor tracks the blood gas far worse there (CO₂ change correlation 0.54 against 0.74). |
Takeaways
- Pair a blood gas with the monitor at the estimated draw, not at the lab stamp. Pooled over patients the difference is small, but within a patient the monitor tracks the blood gas much better at the draw (CO₂: 0.74 against 0.54; oximetry below the ceiling: 0.69 against 0.34), and agreement peaks there for both.
- Expect wide scatter between patients: PaCO₂ − EtCO₂ is a property of each patient (dead space), so one patient's gradient says little about another's.
- Average the monitor over a minute or so around the draw; the single nearest reading adds more uncertainty than the draw time does.
- SaO₂ − SpO₂ at high saturation is set by the 100% ceiling and the 1% grid, not by physiology; treat SpO₂ = 100 as censored.
Limitations
- The match between a blood gas and an arterial-line access is evidence, not proof: 77% of gases had an access in the window against 26% of random times. A wrong match is not part of the per-gas interval.
- The draw is taken to happen during the access; a sample drawn after the line was flushed and closed again would be missed.
- The lab value's analyser error and the oximeter's stated accuracy (a few percentage points) are not included; both are larger than the rounding.
- The vitaldb-resolution library gives a recorded SaO₂ of 100 an upper bound of 100.475; the example caps it at 100.
Open questions and future work
- SaO₂ above 100 in the library (next step). vitaldb-resolution treats a recorded SaO₂ of 100 like any other whole number, with the true value up to 100.475. A cap at 100 (a top-coded value, like the other reporting limits) would fix this at the source.
- Is SaO₂ measured or calculated? (untestable assumption). Many blood-gas analysers calculate SaO₂ from PO₂ and pH rather than measuring it by co-oximetry. Which was used decides whether SaO₂ − SpO₂ compares two measurements or a measurement with a model.
Studies it relies on
| Study | Date | Status | Summary |
|---|---|---|---|
| What the lab timestamp marks | 2026-10-13 | current | VitalDB's lab time is a per-specimen timestamp: not the draw, and not the result. Blood gases are stamped 3–12 minutes after the draw, central-lab panels about 8–24 minutes after it, and the result follows a turnaround the release does not record. |
| SpO₂ and pulse rate latency from step events | 2026-10-12 | current | SpO₂ cannot be recomputed from one plethysmogram, so its timing comes from events that change the PLETH abruptly. SpO₂ lags the recorded PLETH by about 4 s and then smooths over roughly 10–20 s. |
| Arterial line accesses in the pressure waveform | 2026-10-11 | current | Flushes, zeroing and blood draws leave clear signatures in the arterial pressure. A detector finds them in the waveform alone (about one access per hour) and matches 77% of lab draws to an access within 15 minutes, against 26% for random times. |
Observations it relies on
| Observation | Status | Summary |
|---|---|---|
| Monitor numerics describe the past, never the future | established | Every monitor numeric describes a window of 3–30 s or more that ended 1–9 s before its stamp. None is stamped before its data exist, so the stamps already respect the availability rule. |
| The lab time is neither the draw nor the result | established | VitalDB's lab timestamp marks the specimen (logged at the lab, or entered from a theatre analyser): minutes after the draw and before the result, whose time is not recorded. |
Reproduce it
python examples/blood_gas_gradients.py run --resolution <vitaldb-resolution at the pinned commit> \
    --root <VitalDB release> --draws-csv lab_draw_labels.csv --out out/bg --cases 0:130   # repeat over chunks
python examples/blood_gas_gradients.py summarise --out out/bg --root <VitalDB release> \
    --draws-csv lab_draw_labels.csv --figure 136-1 16-3
python examples/blood_gas_gradients.py lagscan --root <VitalDB release> --draws-csv lab_draw_labels.csv \
    --out out/bg --cases 0:140   # repeat over chunks: the monitor at every minute around the draw
python examples/blood_gas_gradients.py lagsummary --out out/bg   # change figure and timing scans
References
- Eytan D, Mazwi ML, Goodwin AJ, Goodfellow SD, Assadi A, Greer RW, Jegatheeswaran A, Laussen PC. Revisiting oxygen dissociation curves and bedside measured arterial saturation in critically ill children. Intensive Care Med. 2019;45(12):1832-1834. ↗