Rounding and heaping of estimated blood loss
Recorded estimated blood loss is a mixture of 5 rounding modes (preferred small values, 500 mL, 100 mL, 50 mL, 10 mL (base)); the model gives the true value's distribution for each record.
| Date | 2026-10-18 |
| Status | current |
| Methods | Rounding, heaping and value resolution |
| Variables | Estimated blood loss |
Background
- Estimated blood loss (
intraop_ebl) is a hand-entered EMR total. - It behaves differently from urine output in two ways: the rounding grain grows with the size of the estimate, and 50 mL looks like a default for "minimal" loss.
- Blood loss is itself an estimate. Nothing is measured to the millilitre, so the "true" value is what a careful estimator would have said, and rounding absorbs estimation coarseness as well as charting preference.
Data
- 3,987 non-missing values (2,401 missing, 38%) and 11 zeros. The maximum is 30,100 mL, and 214 values are above 1,000 mL.
- 17 positive values are not multiples of 5 (e.g. 2, 12, 472 mL). Only 26 (0.7%) are odd multiples of 5, so the resolution is overridden to 10 mL.
- Cases with a recorded blood loss are longer (median 3.6 h, against 2.0 h when missing). Blood loss and urine output are both missing in 1,659 cases.
- The fit uses 3,933 positive values on the 10 mL grid.
Method
- Heaping was screened by magnitude: the share of values whose coarsest anchor is 10, 50, 100, 500 or 1,000 mL, in seven recorded ranges.
- All candidate models use a log-spline latent with K = 6.
- Relative modes (leading digit, half, tenth) were compared with absolute modes (500, 100, 50 mL on a 10 mL base), both with propensities that vary with log volume.
- A preferred-value set {10, 20, 30, 50} below 75 mL was added and tested.
- A separate nominal 50 mL component below a threshold T was tested on top (best T = 200 mL).
- The model was refitted without the 30,100 mL value to check its influence.
Results
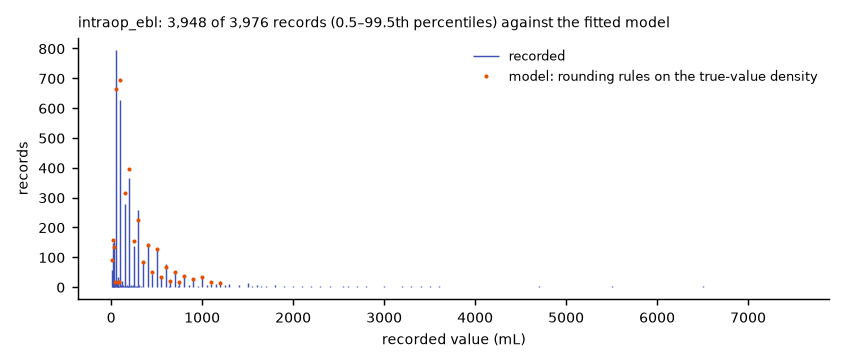
- The grain scales with magnitude. Below 50 mL, 95% of values are multiples of 10. From 100 mL the dominant step is 100 mL, and above 500 mL the 500 and 1,000 mL anchors appear.
- 50 mL holds 795 records, 20% of all values, and the 50–99 mL band is 91% exactly 50. Meanwhile 40 mL has only 14 records against 155 at 30 mL.
- Neighbours of anchors are almost empty: the multiples of 10 from 60 to 90 mL total 75 records against 627 at 100 mL.
- Absolute modes beat relative modes decisively (AIC lower by more than 2,500). Relative modes cannot produce the 50 mL steps that dominate 100–999 mL.
- Below 75 mL, about 40% of estimates go to the nearest of 10, 20, 30 or 50 mL, skipping 40. This captures both the 50 mL heap and the missing 40s.
- Representative posteriors: a recorded 30 mL has 95% interval 25.5–39.5 mL; 50 mL, 26.5–73.5; 300 mL, 254.5–344.5; 1,000 mL, 779.5–1,188.5.
- Since vitaldb-resolution v0.6.0 (18 October; model version 2): anaesthesia duration is a covariate of the latent volume (BIC better by 1,751). Department on the rounding propensities made the fit worse (BIC +51) and is not used. Rounding to the nearest anchor beats floor rounding by BIC.
Discussion
- Relative precision of this kind is typical of a visual estimate, so every mode's propensity has to depend on magnitude, not just one.
- A nominal "minimal loss" 50 mL component adds little once the preferred-value set is in (BIC within 4). The working model omits it.
- The 30,100 mL value does not distort the fit. Without it, the latent median (137 mL) and all propensities are unchanged to two decimal places; only the latent 99th percentile moves (3,636 to 3,549 mL).
- The preferred-value set introduced a new mode type ("set") to the engine.
Limitations
- Some misfit remains, mostly too few 70–80 mL and too many 90 mL predictions.
- Capture windows are much wider than for urine output, because anchor neighbours are nearly empty.
- The 30,100 mL value is kept and flagged.
Model
Model file: …/models/intraop_ebl.model.json. Read from the pinned snapshot of vitaldb-resolution at commit bb03ddfc8a (2026-10-18).
How a true value becomes the recorded one. The rules are tried in order: a record not taken by an earlier rule is taken by this one with the probability shown (where its condition holds); the last rule takes the rest. Shares of all records depend on the conditions and the true value, so the model must be evaluated for them; the probabilities below are the fitted ones.
| Order | Rule | Rounds to | Probability if reached | Applies when |
|---|---|---|---|---|
| 1 | preferred small values | nearest | 42.1 % | true value below 75 |
| 2 | 500 mL | 500 mL (nearest) | 1.9 % | varies with the value (shown at 150) |
| 3 | 100 mL | 100 mL (nearest) | 23.8 % | varies with the value (shown at 150) |
| 4 | 50 mL | 50 mL (nearest) | 87.7 % | varies with the value (shown at 150) |
| 5 | 10 mL (base) | 10 mL (nearest) | the rest | always |
| Recorded resolution | 1 (modelled at 10) |
| True-value density | log_spline |
| Fitted on | 3,882 records (VitalDB clinical_data.csv (intraop_ebl), positive values on the 10 mL grid with a usable anaesthesia duration) |
| BIC | 22,390 |
| Fitted | 2026-10-18 |
- Only 0.7% of values are odd multiples of 5 and 17 are off any 5 mL grid; working resolution 10 mL.
Worked examples
| Example | Side | Status | Summary |
|---|---|---|---|
| Intraoperative fluid balance as a distribution | value | draft | Fluids in minus fluids out, each a heaped charted volume, as a distribution per case: the recording alone makes a balance uncertain by about ±60 mL, and by ±190 mL when the blood loss was written as a round 500 mL. |
Code
Tags: generated, vitaldb-resolution