Arterial line accesses in the pressure waveform
Flushes, zeroing and blood draws leave clear signatures in the arterial pressure. A detector finds them in the waveform alone (about one access per hour) and matches 77% of lab draws to an access within 15 minutes, against 26% for random times.
| Date | 2026-10-11 |
| Status | current |
| Methods | Clinical and laboratory times, Does the waveform run on? |
| Techniques | Null controls |
| Devices | SNUADC, Solar8000 monitor, Clinical records |
| Variables | Arterial pressure (SNUADC), Blood gas result time, Central lab result time, Non-invasive blood pressure, Plethysmogram (SNUADC), ECG lead II (SNUADC) |
Background
A blood sample for the lab is drawn from the arterial line, which interrupts the pressure trace. Finding those interruptions gives the draw time, which the lab table does not record, and marks stretches where arterial timing should not be trusted.
Data
Every case with three or more blood draws during surgery plus the 204 benchmark cases with an arterial line, 1,440 cases and 7,507 hours; 50 accesses checked by eye.
Method
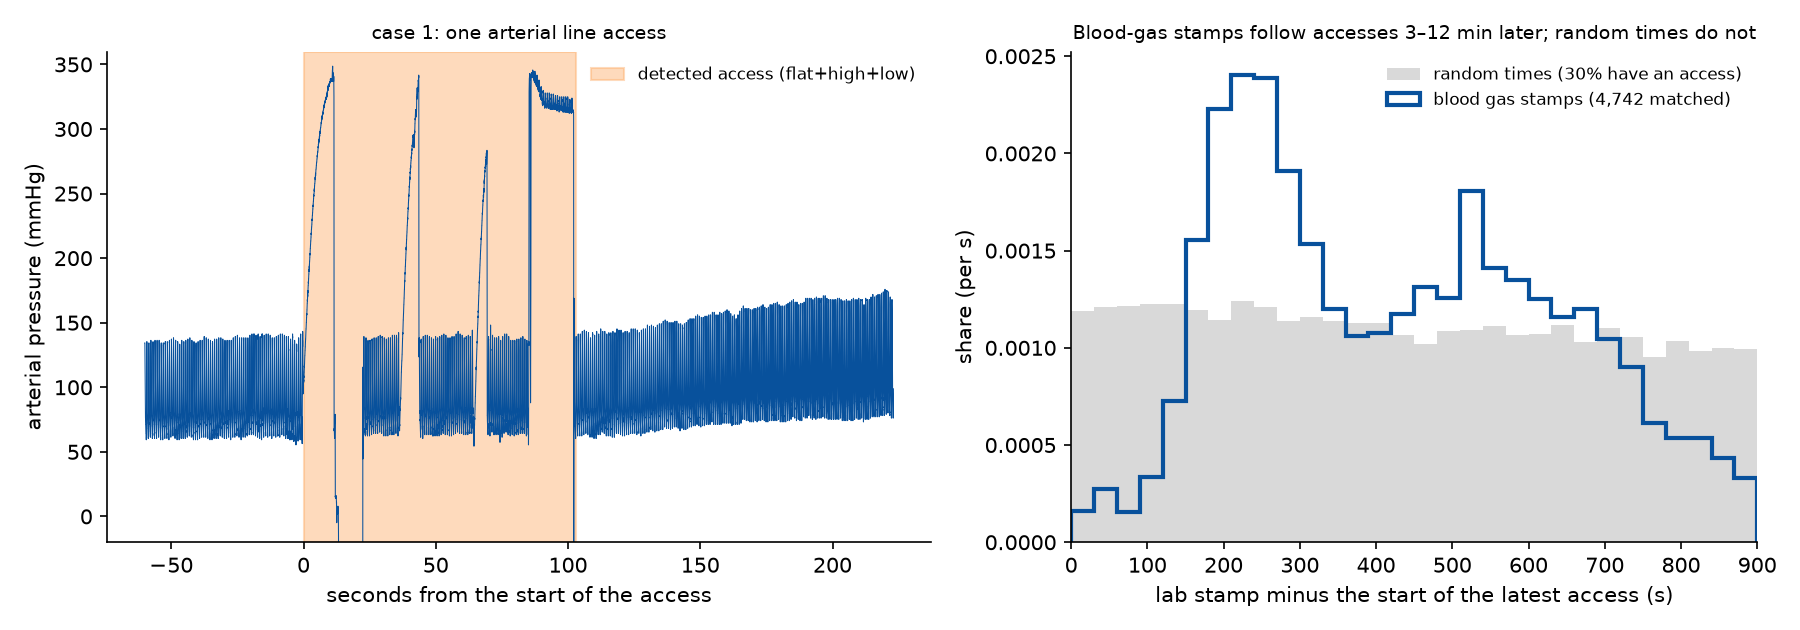
lineaccess (a standalone MIT module) classifies 1 s windows as high (a flush from the pressure bag, over 200 mmHg), low (open to air, zeroing, disconnection, under 10 mmHg) or flat (no pulse, after removing a linear trend), merges them into events, groups events less than 90 s apart into one access, and gives each a recovery period until the pulse is back to 70% of its size. A lost pulse with no flush or zero is an occlusion; stretches over 5 minutes are unavailable. Accesses were matched to lab times, and arterial-side timing steps (ECG→ABP moves, ECG→PPG does not) to accesses, with random times as controls.
Results
- 8,245 accesses (1.1 per hour), 3,249 occlusions (0.4 per hour), 590 hours unavailable.
- Precision 33 of 34 on a visual check of 50 random events. Most "lost pulse only" events were a blood pressure cuff inflating on the arm with the line: 66% have an NIBP reading 0–90 s later, against 24% at random.
- Lab draws: 76.6% follow an access within 15 minutes, against 26% for random times.
- Arterial-side timing steps cluster at line events: 24% fall within 60 s of an access or occlusion, against 4.5% at random. Cuff inflations disturb arterial timing as much as line accesses do.
- Blood-gas stamps follow an access by two typical delays, about 4 and about 9 minutes (median 410 s over 4,742 matched gases); random times in the same recordings show no such peak.
| Parameter | Value | Status | From |
|---|---|---|---|
| Arterial line access rate | 1.1 per hour (8,245 in 7,507 h); occlusions 0.4 per hour | measured | Arterial line accesses in the pressure waveform |
Discussion
The access is the best available estimate of a lab draw, and the lab_draw label marks it where one matched. Arterial timing (for example as a check on the PPG correction) should skip accesses and occlusions.
Observations it supports
| Observation | Status | Summary |
|---|---|---|
| Arterial timing steps cluster at line events | established | About a quarter of the steps in ECG→arterial-pressure timing fall within a minute of a line access or a cuff occlusion, against 4.5% at random times. |
| The blood pressure cuff often sits on the arterial line's arm | established | Many "lost pulse" events in the arterial pressure are an NIBP cuff inflating on the same arm: the pulse fades and pressure decays to 35–50 mmHg, then returns as the cuff cycle ends. |
| The lab time is neither the draw nor the result | established | VitalDB's lab timestamp marks the specimen (logged at the lab, or entered from a theatre analyser): minutes after the draw and before the result, whose time is not recorded. |
Limitations
No ground truth for accesses; recall is unchecked. Long real stretches without a pulse (for example bypass) would be labelled unavailable.
Worked examples
| Example | Side | Status | Summary |
|---|---|---|---|
| End-tidal to arterial CO₂, and pulse oximetry against blood gas, at the right moment | time | draft | For 4,281 blood gases, reading the monitor when the blood was drawn rather than at the lab stamp makes changes in end-tidal CO₂ track changes in arterial CO₂ far better (within-patient correlation 0.74 against 0.54), and agreement peaks exactly at the estimated draw. Oximetry shows the same timing (agreement peaks at the draw), but the 100% ceiling hides the size of the oximetry gradient for three gases in four. |