Draft
Worked through on a few cases; numbers may change.
Minutes of hypotension per patient, from the monitor and from the waveform
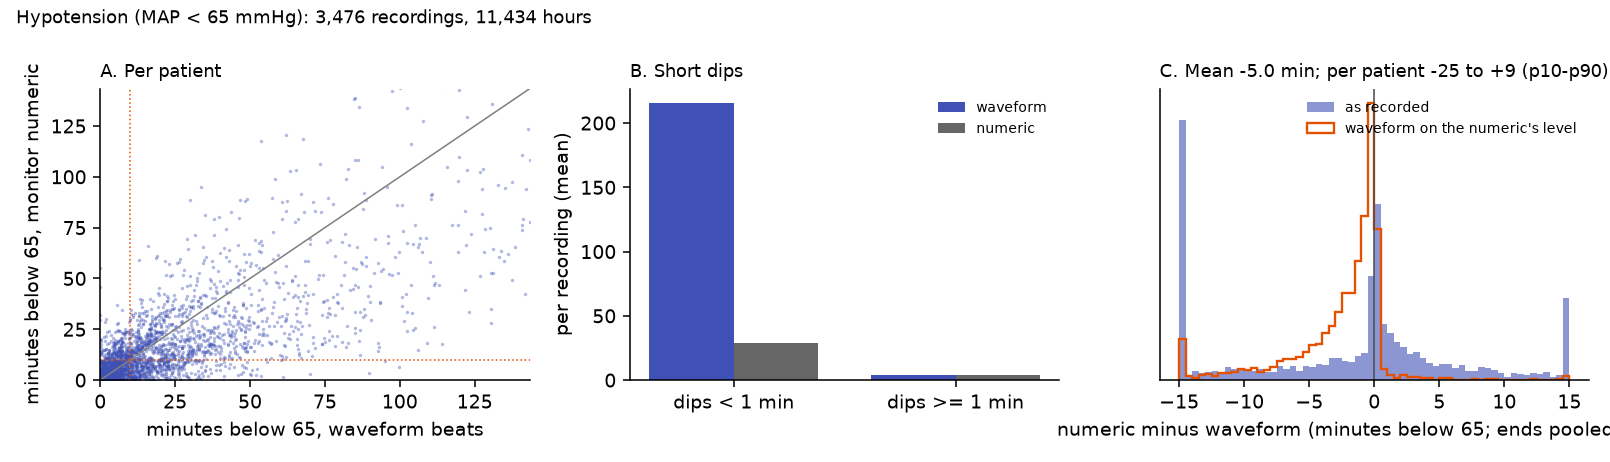
Minutes with MAP below 65 mmHg in 3,476 recordings, from the monitor's numeric and from the arterial waveform's beats: the two routes to one pressure differ by several mmHg per patient, which moves half of all patients' minutes by 5 or more and a fifth of their labels, and the numeric's averaging hides short dips in every patient.
| Side | both |
| Status | draft |
| Variables | Solar8000 ART and CVP numerics, Arterial pressure (SNUADC) |
| Studies | How the monitors compute their numbers, Numeric delays are fixed within a case, different between cases |
The question
How many minutes was each patient's mean arterial pressure below 65 mmHg, and does it matter whether the minutes come from the monitor's numeric or from the waveform?
Inputs
Each input links to its measurement page: how it is timed, how its value was recorded, and how uncertain both are.
| Input | Unit | What it is |
|---|---|---|
| Solar8000 ART and CVP numerics | mmHg | Arterial and central venous pressure values from the Solar8000 monitor. |
| Arterial pressure (SNUADC) | mmHg | Invasive arterial pressure, sampled by SNUADC at 500 Hz from the monitor's analogue output. |
Why the atlas changes the answer
Hypotension burden is usually computed from the monitor's mean pressure numeric (Solar8000 ART_MBP): an integer every 2 s, an exponential average over beats, about 2 s late (How the monitors compute their numbers, Solar8000 ART mean delay). The same pressure reaches the recorder as the SNUADC waveform, from the monitor's analogue output, where each beat's mean can be computed. The two differ in level (scale, not timing: pressure numerics sit a few mmHg from the analogue waveform), in averaging, and in rounding.
Data
Every recording with both the ART_MBP numeric and the SNUADC arterial waveform and at least 30 minutes of common, plausible data: 3,476 recordings, 11,434 hours.
Steps
- Beat means from the waveform (pressure averaged from one diastolic foot to the next); the numeric moved 1.7 s earlier for its delay.
- A 30 s plausibility screen on both (mean 20–200 mmHg, pulse pressure 10–150 mmHg, no flat line), and only the time both are plausible, so that flushes and zeroing are left out of both.
- Per patient: minutes below 65, area below 65, dips shorter and longer than 1 minute, and two labels (any minute continuously below 65; 10 minutes or more in total), from the numeric (< 65 and ≤ 65, since it is an integer) and from the waveform, as recorded and moved onto the numeric's level (the median difference in that recording), which separates level from dynamics.
Results
The two routes disagree in level, patient by patient. The numeric minus the waveform's beat mean is a median −1.2 mmHg, but −5.7 to +5.8 mmHg between the 10th and 90th percentile of patients: a constant offset within a recording, from the analogue chain.
Per patient, that decides the minutes.
| Numeric | Waveform | Waveform on the numeric's level | |
|---|---|---|---|
| Minutes below 65, median per patient | 7.2 | 8.3 | 9.3 |
| Minutes below 65, mean | 18.2 | 23.2 | 20.9 |
| 10 minutes or more below 65 | 41.9% | 46.6% | 48.2% |
| Dips under 1 minute, per recording | 29 | 216 | 221 |
Half the patients (49%) differ by 5 minutes or more between numeric and waveform (median 4.7 minutes), and the "10 minutes below 65" label differs for 19% of them. Over the cohort the waveform gives 5.0 more minutes on average (95% interval 4.3 to 5.7): the level offsets do not cancel, because a patient whose waveform sits lower gains far more minutes than one whose waveform sits higher loses.
With the level removed, the averaging is left. On the numeric's level the waveform still gives more time below 65 in almost every patient (median 1.3 minutes more; mean 2.7): the numeric's average smooths away the short dips, 29 per recording against 216. The label then differs for 7% of patients.
The definition matters too. The numeric is an integer, so ≤ 65 counts every reading of exactly 65: a median 1.6 more minutes per patient (7.8 at the 90th percentile), and the 10-minute label changes for 6%.
Population and individual
Both: part cancels, part does not.
| The cohort | The cohort mean moves by 5 minutes between the two routes, and by 2.7 minutes from the averaging alone: neither cancels. |
| Each patient | A level offset of up to ±6 mmHg per patient moves half of all patients' minutes by 5 or more and a fifth of their 10-minute labels. |
Takeaways
- State which pressure a hypotension burden comes from (monitor numeric or waveform) and how "below 65" treats integer values; these choices move a patient's minutes more than many interventions do.
- The level offset between the monitor and its analogue output is a property of each recording: calibrate one against the other per recording before combining them.
- Short dips exist only in the waveform; any definition that counts brief hypotension depends on the source.
Limitations
- Neither route is the truth: the level offset says the two disagree, not which is right. The monitor's own numeric is calibrated by its transducer zero; the analogue output passes through one more conversion.
- The plausibility screen removes obvious artefacts only; damped or over-resonant lines are not detected.
- Area and minutes are counted over the whole recording, not only the anaesthetic.
Studies it relies on
| Study | Date | Status | Summary |
|---|---|---|---|
| How the monitors compute their numbers | 2026-10-12 | current | Recomputing each monitor numeric from its own waveform finds a short, simple algorithm for every one (a median, an exponential average or a time mean over 3–30 s) and a delay of 2–9 s behind the newest data it uses. No value is stamped before its data exist. |
| Numeric delays are fixed within a case, different between cases | 2026-10-12 | current | With each numeric's algorithm held fixed, delays were fitted for every case and every 30-minute block. They do not drift within a case, but 40–70% of their variance lies between cases, so a single population delay is wrong by up to 2 s for HR and 1 s for the others. Each case gets its own delay label. |
Reproduce it
bash examples/run_scan.sh hypotension_burden          # 8 parallel parts, about 15 minutes
python examples/hypotension_burden.py agg <work>/examples/hypotension_burden/part_*.jsonl --out out/hypotension