One device delay for the PLETH across the release
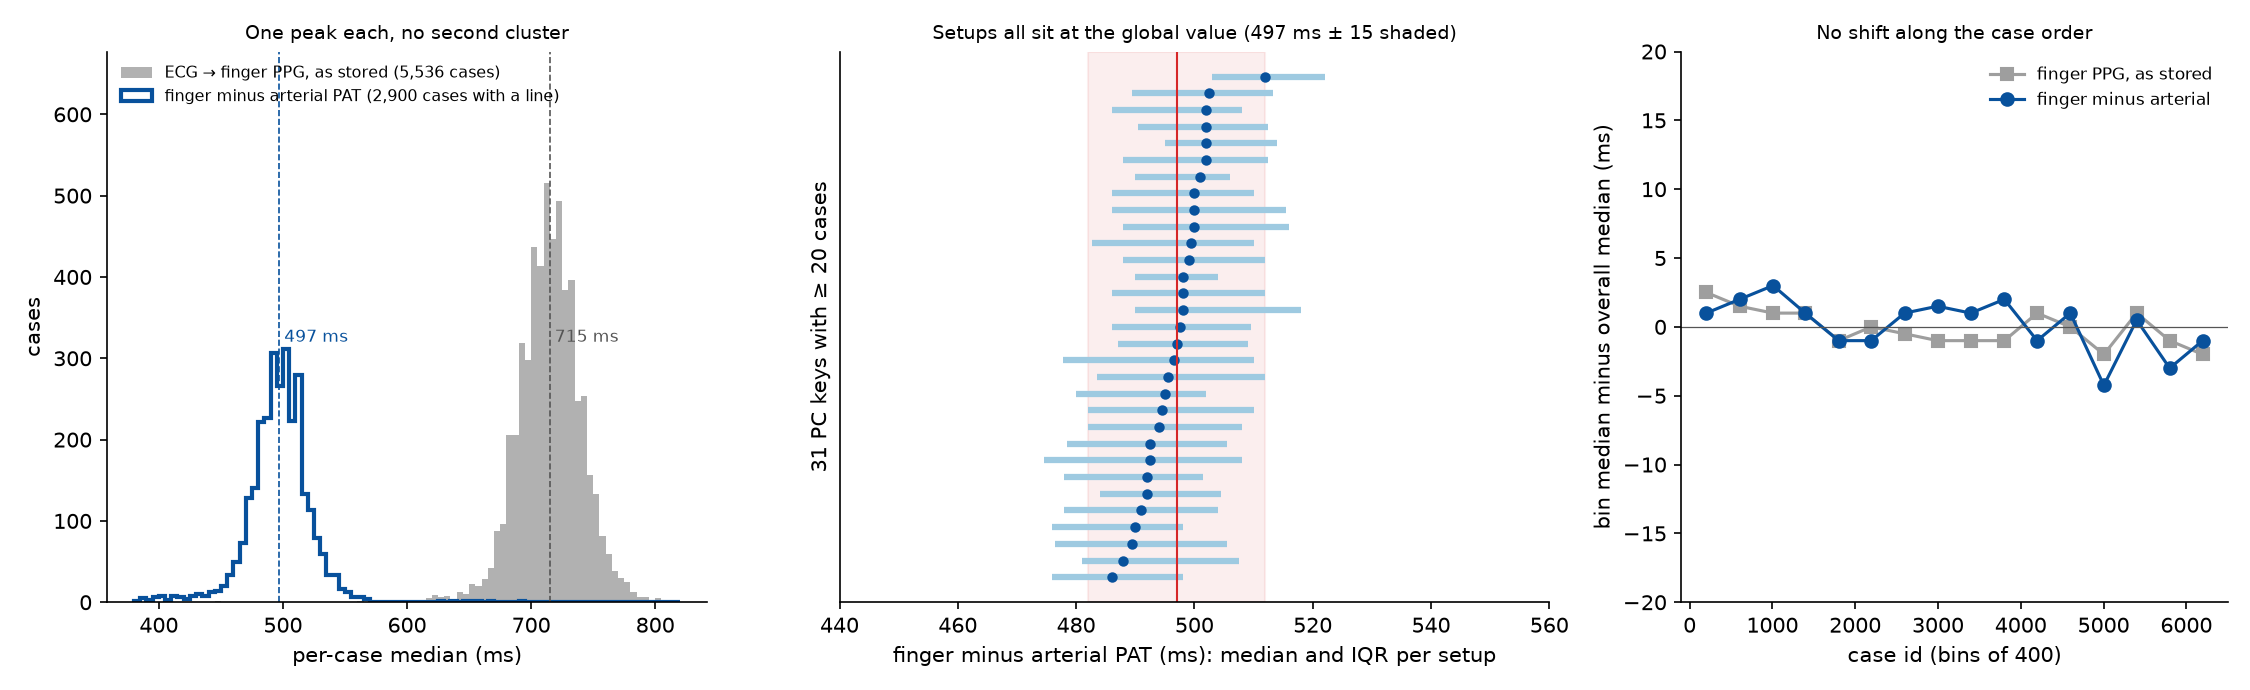
The stored ECG-to-PLETH delay was measured in 5,536 recordings, to the foot and to the steepest upstroke of each pulse. It has one peak (655 ms to the foot, 715 ms to the upstroke, in the median recording), no clusters by recording setup or SNUADC port, and no shift along the case order: one global device delay, 385 ms with an adopted R-to-foot finger PAT of 270 ms, fits the whole release, as Ruffolo et al. found in their own data.
| Date | 2026-10-18 |
| Status | current |
| Methods | Delays and averaging windows, Clocks carried in the signal |
| Techniques | Beat matching |
| Clocks | Pulse oximeter frame clock |
| Devices | SNUADC, Solar8000 monitor |
| Variables | Plethysmogram (SNUADC), ECG lead II (SNUADC), Arterial pressure (SNUADC) |
Background
The PLETH reaches the recorder about 0.4 s late (The PLETH arrives about 0.4 s late). The PAT example first removed each case's own offset, which also removed real differences in PAT between patients. Whether one delay fits every recording, or one per setup or per epoch, decides how the delay can be removed without that loss. Ruffolo et al. 2025 saw one global offset (two, over two epochs) in their own monitoring system.
Data
Every recording with ECG lead II and PLETH at 500 Hz (6,136 of 6,388); 5,536 passed the quality rule below, 2,900 of them with an arterial line. Setups are the PC keys of Identifying the recording setup of every case.
Method
- Per recording, 8 segments of 2 minutes spread over the ECG–PLETH overlap from 10 minutes in. In each: R peaks, and per pulse in the PLETH (and in the arterial pressure where there is a line) the steepest upstroke and the foot (intersecting tangent: where the tangent at the steepest upstroke meets the level of the preceding minimum).
- Pairing by the modal delay. The stored delay (about 0.7 s) is longer than one RR interval at fast heart rates, so a nearest-after search pairs pulses one beat out. All R-to-upstroke lags within 0.1–1.2 s are histogrammed per segment; a constant delay makes one sharp peak, while pairings one beat out move with the RR interval and smear. Each R peak then takes the upstroke nearest the mode.
- A segment counts if at least half of all lags lie within 20 ms of the mode and the per-beat spread (IQR) is at most 30 ms; a recording needs 3 such segments. The per-case value is the median over its segments.
- Finger minus arterial PAT, beat by beat, removes most of the patient's own PAT, so its spread between recordings shows the device delay's structure far more sharply than the finger PAT alone.
Results
- One peak. Stored ECG→PLETH delay to the steepest upstroke: 715 ms in the median recording (interquartile range 699–730 ms). Finger minus arterial PAT: 497 ms (484–510 ms; 5th–95th percentile 456–532 ms). Neither has a second cluster.
- The setup explains almost nothing: 4% of the variance of finger minus arterial PAT between recordings (PC key, 57 keys) and 2% (SNUADC port). Every one of the 31 keys with at least 20 recordings has its median within about ±15 ms of the global value, and each key's own spread is wider than the gaps between keys. The earlier per-setup delays (368–399 ms, from 293 cases) were mostly sampling noise.
- No epochs along the case order. In 16 bins of 400 cases the median moves by at most 4 ms.
- Stable within a recording: from the first good segment to the last (2 hours apart in the median case) the stored delay changes by −4 ms (interquartile range −24 to +16).
- The stored delay keeps the patient's PAT: per case, stored finger PAT correlates with arterial PAT (Spearman 0.56). Removing one global delay keeps that; removing each case's own offset destroys it.
- Foot and upstroke. To the foot, the stored delay is 655 ms (interquartile range 640–670 ms), with the same single peak and the same absence of setup clusters (setup explains 2% of its variance) and of a trend along the case order (bin medians within 4 ms). The PLETH's foot-to-upstroke time is 59 ms (56.7–62.0 ms) and barely varies. The arterial line: 178 ms to the foot, 216 ms to the upstroke. Finger minus arterial PAT is 475 ms foot to foot.
- The global delay: the adopted 270 ms (The PPG hardware delay and the adopted pulse arrival time) is an R-to-finger-foot value, so the delay is taken at the foot: 655 − 270 = 385 ms, which agrees with the earlier foot-based estimate over 293 cases (385 ms). It implies a finger-minus-radial difference of about 90 ms foot to foot. (A first version used the upstroke, 715 − 270 = 445 ms, which mixed two fiducials.)
| Parameter | Value | Status | From |
|---|---|---|---|
| PPG hardware delay | 385 ms, one global value (stored R-to-foot delay 655 ms minus an adopted 270 ms); setups differ by under ±15 ms | measured | One device delay for the PLETH across the release |
Discussion
One delay fits the release, so PAT can be compared between patients after subtracting it. Only the absolute level rests on an outside value, the adopted finger PAT. Case order is only a proxy for time (the release has no dates), so an epoch change like Ruffolo et al.'s would show here only if case numbers follow recording order.
Observations it supports
| Observation | Status | Summary |
|---|---|---|
| The PLETH arrives about 0.4 s late | established | Raw R-to-PPG-foot pulse arrival time in VitalDB has a median of 0.64–0.71 s, about 0.4 s more than physiology: the monitor's buffering and filtering. One delay fits the whole release: no clusters by setup, SNUADC port or case order (One device delay for the PLETH across the release). |
Limitations
- 600 recordings failed the quality rule, mostly at fast heart rates or with noisy ECG; if their delay differs, the census would miss it.
- The foot is found on the 0.5–10 Hz band-passed pulse, which rounds the corner where the pulse starts to rise; a foot on the raw signal might sit a few milliseconds earlier.
- The sawtooth adds up to one frame (33 ms) to the stored delay; averaged over a recording it is about the same in every case and is part of the global value.
Open questions
- Is 90 ms from radial artery to finger plausible? (untestable assumption). With the global 385 ms, finger PAT exceeds radial-artery PAT by about 90 ms foot to foot. Published values for the radial-to-fingertip pulse transit (and for the volume pulse lagging the pressure pulse) would check the adopted 270 ms independently; a larger or smaller gap there would move the global delay by the same amount.
- Epochs in time (next step). Ruffolo et al. saw two offsets over two epochs. VitalDB has no recording dates; any other ordering of the cases in time (software versions in the file headers, say) would allow a sharper test than the case number.
- Recordings that failed the quality rule (next step). Fast heart rates and noisy ECG make the modal delay ambiguous. A beat-to-beat pairing that uses the ECG's RR interval explicitly would bring most of the 600 back into the census.
Worked examples
| Example | Side | Status | Summary |
|---|---|---|---|
| Pulse arrival time against blood pressure, before and after synchronisation | time | draft | In 3,270 recordings, PAT tracks systolic pressure only once each pulse is paired with its own beat: the hourly correlation moves from a mean of −0.04 to −0.21 (88% of recordings negative), reproducing Ruffolo et al. 2025 in a second dataset; paired naively, PAT is a heart-rate signal. |
Code
References
- Ruffolo I, Siddiqui A, Nguyen B, Dixon W, Assadi A, Greer R, Schwartz S, Brudno M, Mariakakis A, Goodwin A. High-fidelity measurement of pulse arrival time in critically ill children using standard bedside monitoring equipment. Physiol Meas. 2025;46(11):115006. ↗