Skip to content

Numeric delays are fixed within a case, different between cases

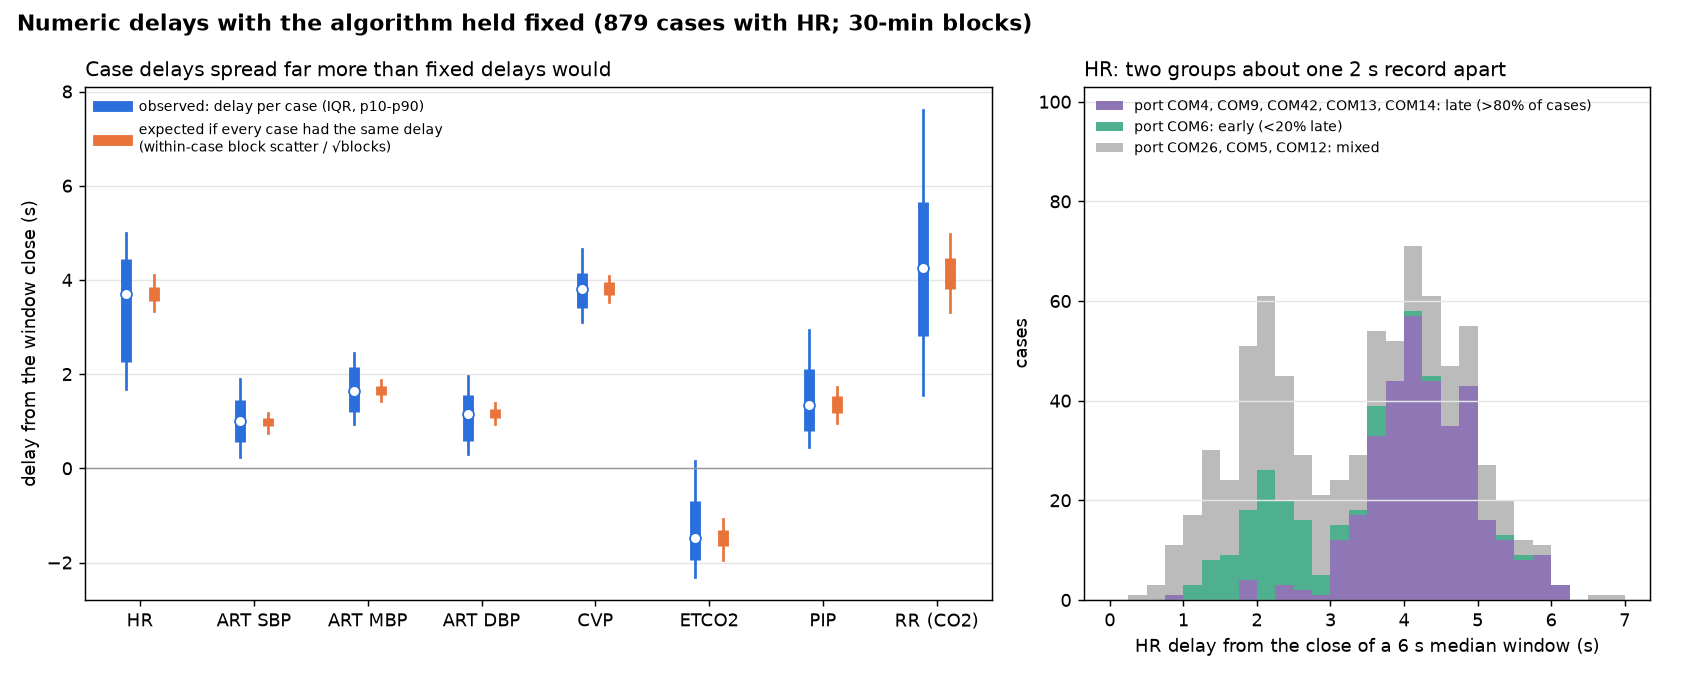
With each numeric's algorithm held fixed, delays were fitted for every case and every 30-minute block. They do not drift within a case, but 40–70% of their variance lies between cases, so a single population delay is wrong by up to 2 s for HR and 1 s for the others. Each case gets its own delay label.

Date 2026-10-12
Status current
Methods Delays and averaging windows
Devices Solar8000 monitor, Primus anaesthesia machine
Variables Solar8000 heart rate, Solar8000 ART and CVP numerics, Primus ETCO₂, PIP and RR

Data

900 random cases with SNUADC and Solar8000, then 6,387 of 6,388 cases (one file too large for the analysis machine); Primus ETCO₂ and PIP refitted in all 6,199 Primus cases on 13 October.

Method

The pilot's consensus algorithm for each track; the delay fitted per case and per 30-minute block with the same uniform-phase likelihood; variance split by a one-way random-effects model on the block delays (between-case SD, within-case SD, intraclass correlation); case delays compared with set-up variables and across tracks.

Results

Track Delay from window end, p10 / p50 / p90 (s) Between-case SD (s) ICC
HR 1.7 / 3.7 / 5.0 1.31 0.71
ART systolic 0.3 / 1.0 / 1.9 0.79 0.61
ART mean 1.0 / 1.7 / 2.5 0.78 0.61
ART diastolic 0.3 / 1.2 / 2.0 0.87 0.68
CVP 3.1 / 3.8 / 4.7 0.60 0.41
Primus ETCO₂ 0.75 / 1.55 / 3.4 0.94 0.58
Primus PIP 3.65 / 4.6 / 6.5 0.96 0.55
Primus RR 1.6 / 4.3 / 7.6 1.98 0.67
  • No drift within cases (median 0 s/h).
  • Shared offsets within a device family: the three arterial pressure delays correlate at ρ 0.86–0.92; across families hardly at all.
  • HR is the only track whose delay follows the Solar8000 port (η² 0.35): two groups (Two heart-rate delay groups, one poll apart).
  • The first Primus fit gave ETCO₂ a delay of −1.5 s, which the availability rule forbids: the hold until the next breath had been counted twice. Refitted with a one-record phase, every median delay is positive.
Parameter Value Status From
Solar8000 ART mean delay 1.7 s (p10–p90 1.0 to 2.5) measured Numeric delays are fixed within a case, different between cases
Solar8000 CVP delay 3.8 s (p10–p90 3.1 to 4.7) measured Numeric delays are fixed within a case, different between cases
Primus ETCO₂ delay 1.55 s (p10–p90 0.75 to 3.4) measured Numeric delays are fixed within a case, different between cases
Primus PIP delay 4.6 s (p10–p90 3.65 to 6.5) measured Numeric delays are fixed within a case, different between cases
Primus RR delay 4.3 s (p10–p90 1.6 to 7.6) measured Numeric delays are fixed within a case, different between cases
Drift of Solar8000 numeric delays within a case 0 s/h median (p10–p90 about ±0.5 s/h) measured Numeric delays are fixed within a case, different between cases

Discussion

One delay per case is enough; per-record labels are not needed. Per-case labels (numeric_delay) carry the delay, its standard error (median 0.15–0.29 s, 1.0 s for RR) and a quality flag; 607 per-case delays that still come out below zero are flagged weak. The population distribution is the prior where a case cannot be fitted.

Observations it supports

Observation Status Summary
Monitor numerics describe the past, never the future established Every monitor numeric describes a window of 3–30 s or more that ended 1–9 s before its stamp. None is stamped before its data exist, so the stamps already respect the availability rule.
Numeric delays are fixed within a case but differ between cases established A numeric's delay does not drift through a recording, but 40–70% of its variance lies between cases. One delay per case describes it; one delay for the whole dataset is wrong by up to about 2 s.

Worked examples

Example Side Status Summary
Minutes of hypotension per patient, from the monitor and from the waveform both draft Minutes with MAP below 65 mmHg in 3,476 recordings, from the monitor's numeric and from the arterial waveform's beats: the two routes to one pressure differ by several mmHg per patient, which moves half of all patients' minutes by 5 or more and a fifth of their labels, and the numeric's averaging hides short dips in every patient.
Code

Figures

Paired range bars, observed against expected, per numeric.
Delays differ between cases far more than a fixed delay would allow (first run, 879 cases; a 6,222-case version is to replace it).