Draft
Worked through on a few cases; numbers may change.
Cuff pressure against the arterial line
12,238 cuff readings against the arterial line at the cuff's own moment, in 2,283 patients: no bias over the cohort at any pressure, but each patient's cuff reads a constant 10 mmHg (SD) above or below their line, and half the arterial readings below 65 mmHg are not below 65 by cuff.
| Side | both |
| Status | draft |
| Variables | Non-invasive blood pressure, Solar8000 ART and CVP numerics |
| Studies | How the monitors compute their numbers |
The question
When a patient has both, how well does the cuff (non-invasive) mean pressure agree with the arterial line, over a cohort and for one patient, and at what moment does a cuff reading apply?
Inputs
Each input links to its measurement page: how it is timed, how its value was recorded, and how uncertain both are.
| Input | Unit | What it is |
|---|---|---|
| Non-invasive blood pressure | mmHg | Cuff blood pressure, recorded after each cuff cycle. |
| Solar8000 ART and CVP numerics | mmHg | Arterial and central venous pressure values from the Solar8000 monitor. |
Why the atlas changes the answer
A cuff reading takes tens of seconds and is reported once, as a held value; comparing it with the arterial line needs the moment it belongs to. Beyond timing, the cuff's error has two parts: one that is the same for every reading in a patient (cuff size, arm, vessel) and one that varies from reading to reading. Only the second averages out within a patient; neither shows in a cohort's mean bias.
Data
2,457 recordings with cuff readings while the arterial line ran; 12,238 readings with a clean arterial line around them (no flush or zeroing within a minute), in 2,283 patients.
Steps
- A new cuff reading is a change of the held NIBP_MBP value, or a value after a gap.
- Its moment. For each reading, the arterial mean (ART_MBP numeric) over 10 s windows ending −60 to +60 s from the cuff stamp; the lag at which changes between consecutive readings (4,054 pairs, under 10 minutes apart) best follow changes in the arterial mean, which removes each patient's level difference.
- Agreement at that moment: the cohort's mean difference and its dependence on pressure (binned by the mean of the two, as in a Bland–Altman plot; binning by the arterial value alone manufactures a bias at low pressures by regression to the mean); each patient's mean difference; the spread within a patient.
- Hypotension: arterial readings below 65 that the cuff also puts below 65; patients with any reading below 65 by each.
Results
The cuff value belongs to its stamp. Changes in the cuff follow changes in the arterial mean best for the 10 s ending 2 s after the stamp (bootstrap 95% interval: the same), about the arterial numeric's own delay; the correlation falls from 0.70 there to 0.33 a minute earlier. So the stamp marks the end of the measurement, and the reading can be compared with the arterial line at its stamp.
Over the cohort, no bias. Cuff minus arterial is −0.1 mmHg (limits of agreement −27 to +27), and within ±2 mmHg from 40 to 110 mmHg.
Per patient, a constant offset. Each patient's own mean difference ranges from −11 to +13 mmHg (10th to 90th percentile; SD 10.2 between patients), as large as the scatter of readings within a patient (SD 9.4). Repeating cuff readings averages away the second part, never the first.
At the threshold. Of 2,020 arterial readings below 65, the cuff also put 49% below 65; 9% of readings above 65 by arterial line were below 65 by cuff. Of 874 patients with any arterial reading below 65 at a cuff reading, 395 (45%) had no cuff reading below 65; over the cohort, 34% of patients had a cuff reading below 65 against 38% by arterial line.
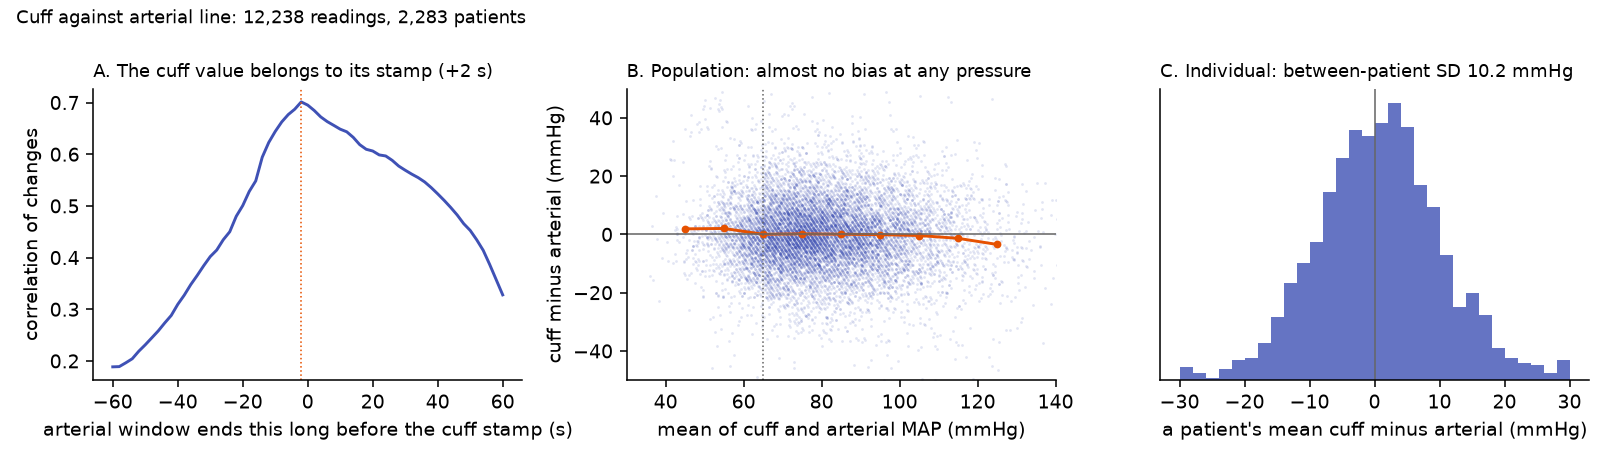
Population and individual
Both: part cancels, part does not.
| The cohort | The mean bias is −0.1 mmHg at every pressure; even so, hypotension is found in 34% of patients by cuff against 38% by arterial line. |
| Each patient | Each patient's cuff sits a constant −11 to +13 mmHg from their arterial line, so 45% of patients with arterial readings below 65 have no cuff reading below 65. |
Takeaways
- Compare a cuff reading with the arterial line at its stamp: the stamp marks the end of the measurement.
- A cohort's zero bias says nothing about one patient: half the cuff's error is fixed per patient, so repeating cuff readings does not remove it.
- A cuff threshold misses arterial hypotension in about half of the readings that matter; a study that defines hypotension by cuff counts a different set of patients.
Limitations
- The arterial line is not the truth either: its level differs between routes (Minutes of hypotension per patient, from the monitor and from the waveform), and a damped line would show as cuff-minus-arterial error.
- Mean pressure only; systolic and diastolic cuff values are known to agree worse.
- Cuff readings are compared only while the arterial line runs, which selects patients and moments.
Studies it relies on
| Study | Date | Status | Summary |
|---|---|---|---|
| How the monitors compute their numbers | 2026-10-12 | current | Recomputing each monitor numeric from its own waveform finds a short, simple algorithm for every one (a median, an exponential average or a time mean over 3–30 s) and a delay of 2–9 s behind the newest data it uses. No value is stamped before its data exist. |
Reproduce it
bash examples/run_scan.sh cuff_vs_arterial             # 8 parallel parts, about 5 minutes
python examples/cuff_vs_arterial.py agg <work>/examples/cuff_vs_arterial/part_*.jsonl --out out/cuff