Blood urea nitrogen
Blood urea nitrogen (lab table).
| Name in the dataset | bun |
| Type | lab |
| Stored in | lab_data.csv |
| Stamped by | Hospital records clock |
| Unit | mg/dL |
Description
Single resolution; no heaping in the whole-number screen.
Its time is the lab system's result time: see Blood gas result time and Central lab result time.
Measurement space
A vertical slice through the measurement space: how the true value is spread around any one recorded value. Its shape is uniform.
Time
Its time side is still to be described.
Value
| Model kind | uniform: single resolution; uniform over the rounding interval |
| Resolution | 1 mg/dL, nearest |
| Native step | 1 mg/dL |
| Anchor | nearest (convention) |
In this release
How wide the true-value distribution is, record by record, over 3,671 of 3,671 records (every lab row of 600 random cases) that have one. Computed with the pinned model, aggregates only.
| Median | p10 to p90 | |
|---|---|---|
| Standard deviation | 0.289 mg/dL | 0.289 to 0.289 mg/dL |
| 95% interval width | 0.95 mg/dL | 0.95 to 0.95 mg/dL |
| Mean minus recorded | 0 mg/dL | 0 to 0 mg/dL |
Anchor
Laboratory results rounded to the last reported digit; at most half the last digit. See what an anchor is and every variable's anchor.
Figures
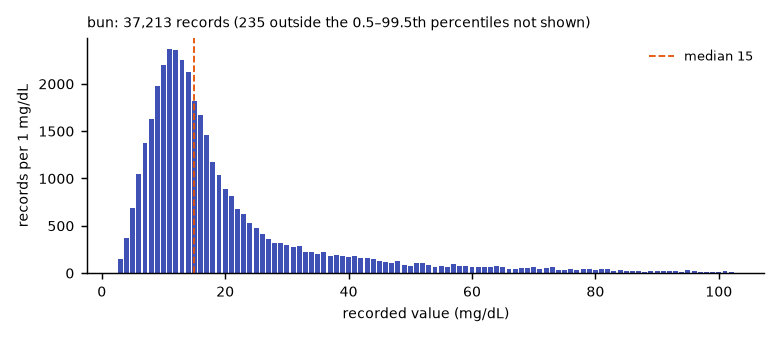
Tags: generated, vitaldb-resolution