Body mass index
Body mass index (clinical table).
| Name in the dataset | bmi |
| Type | clinical |
| Stored in | clinical_data.csv |
| Unit | kg/m2 |
Measurement space
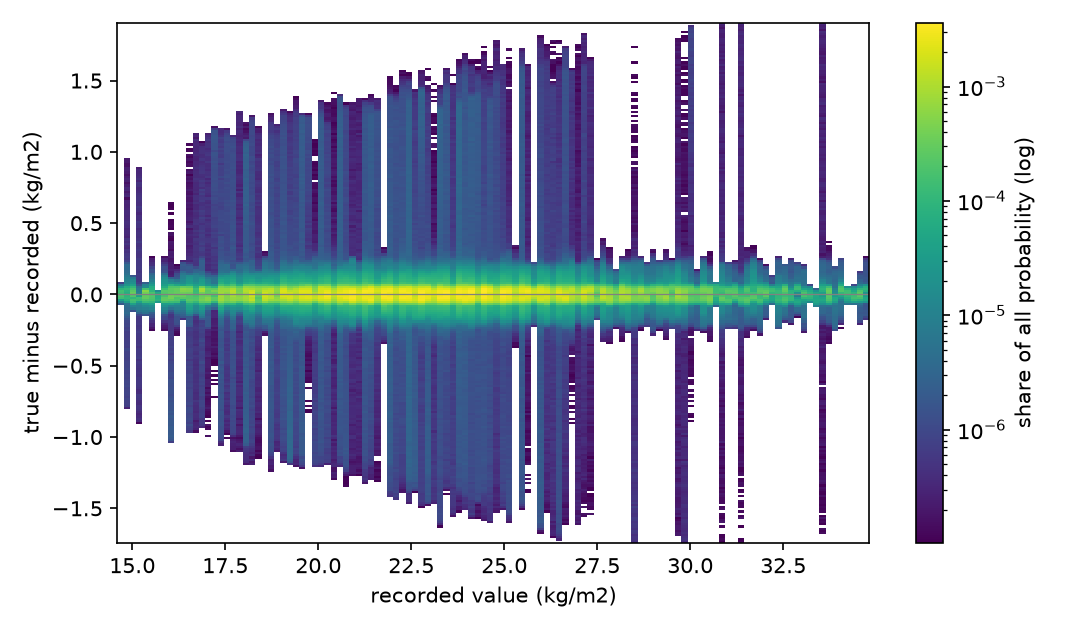
Vertical slices through the measurement space: how the true value is spread around a recorded one, for 4 recorded values chosen to show the different cases. Each panel has its own scale. Each is averaged over every record with that value in the release, from the pinned model; groups of fewer than 20 records are not shown.
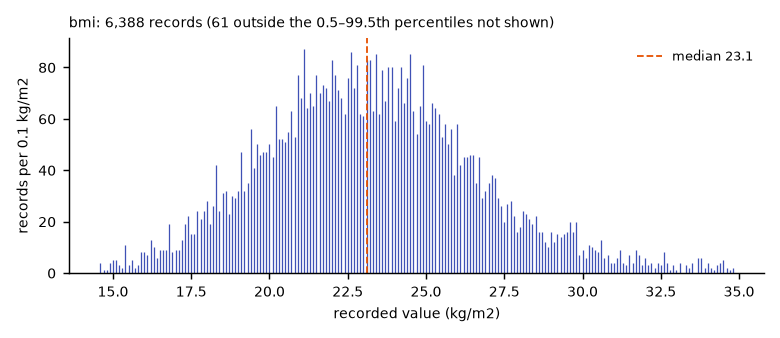
- 21.1 kg/m2 (the commonest recorded value; 87 records): mean -0.00218 kg/m2, SD 0.0623 kg/m2, 95% between -0.0893 and +0.0667. Rounding: weight / (height/100)^2 100%.
- 25.9 kg/m2 (the widest; 38 records): mean -0.0145 kg/m2, SD 0.206 kg/m2, 95% between -0.25 and +0.111. Rounding: weight / (height/100)^2 100%.
- 25.8 kg/m2 (the narrowest; 56 records): mean +0.00542 kg/m2, SD 0.0358 kg/m2, 95% between -0.068 and +0.0615. Rounding: weight / (height/100)^2 100%.
- 23.7 kg/m2 (unlike the others; 67 records): mean +0.00637 kg/m2, SD 0.113 kg/m2, 95% between -0.114 and +0.119. Rounding: weight / (height/100)^2 100%.
Time
This variable carries no time of its own in the dataset.
Value
| Model kind | derived: computed from other variables' posteriors |
| Resolution | derived from height, weight |
| Status | measured |
| Studies | Body mass index, derived from its inputs |
Derived from
Computed from Height and Weight.
In this release
How wide the true-value distribution is, record by record, over 6,388 of 6,388 records (all clinical rows) that have one. Computed with the pinned model, aggregates only.
| Median | p10 to p90 | |
|---|---|---|
| Standard deviation | 0.0142 kg/m2 | 0.0109 to 0.062 kg/m2 |
| 95% interval width | 0.0543 kg/m2 | 0.0411 to 0.308 kg/m2 |
| Mean minus recorded | 0.00175 kg/m2 | -0.0406 to 0.0418 kg/m2 |
Value model
Model file: …/models/bmi.model.json. Read from the pinned snapshot of vitaldb-resolution at commit bb03ddfc8a (2026-10-18).
| Recorded resolution | 0.1 (nearest), as stored |
| Covariates | sex, age, emop, department |
- Derived: weight / (height/100)^2
Studies
| Study | Date | Status | Summary |
|---|---|---|---|
| Body mass index, derived from its inputs | 2026-10-18 | current | Body mass index computed from the posteriors of height, weight. |
Figures
Tags: generated, vitaldb-resolution