The stamp sawtooth model for SNUADC and BIS
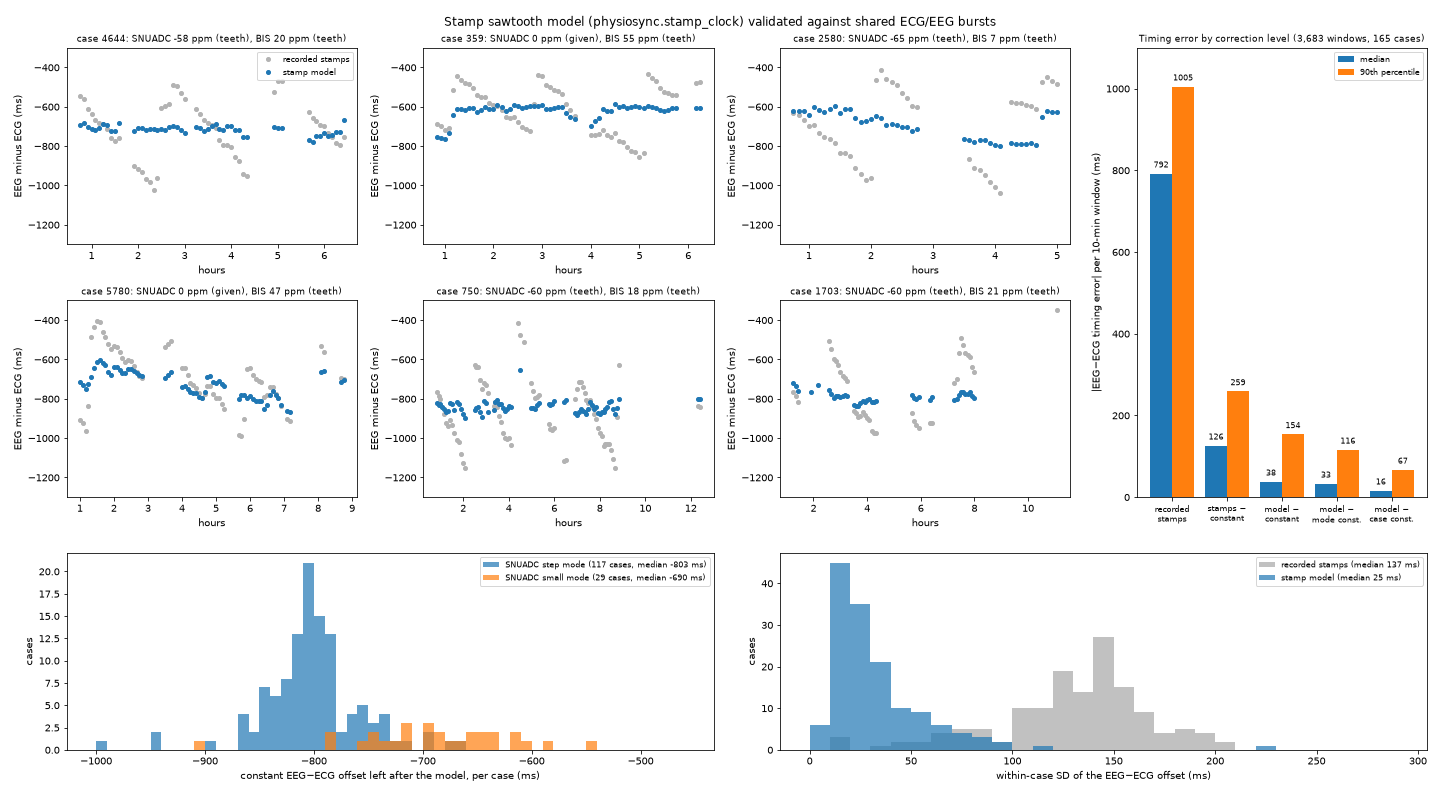
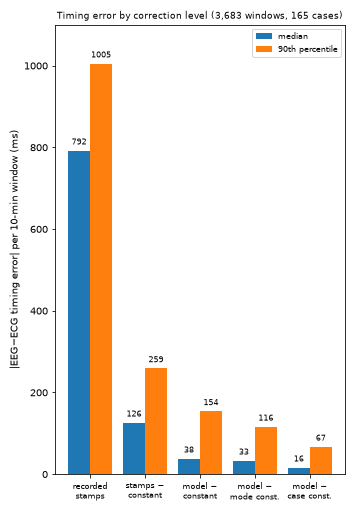
Fitting each track's record stamps against its sample count as a drift with corrections (a sawtooth) puts SNUADC and BIS on one timeline without any artefact. Checked against shared bursts, the EEG–ECG timing error falls from about 790 ms on the recorded stamps to 33 ms with one constant per SNUADC mode in the pilot, and 42 ms over the whole release.
| Date | 2026-10-12 |
| Status | current |
| Methods | Reading the stamps, One event, two clocks |
| Techniques | Sawtooth fit, Windowed cross-correlation |
| Clocks | SNUADC sample clock, BIS clock, Recorder PC clock |
| Devices | SNUADC, BIS monitor, Vital Recorder |
| Variables | ECG lead II (SNUADC), BIS EEG |
Background
Between corrections a device stamps by its own sample count, so the offset between two devices ramps at the difference of their clock rates; the corrections pull each device back towards the recorder's clock. Both are visible in the stamps alone (Shared bursts between the ECG and the EEG).
Data
191 benchmark cases with BIS; validation on 143 cases with at least 5 good burst windows each way, and on 3,683 ten-minute windows in 165 cases. Later refitted on 250 cases with the signal lost at each SNUADC reset. Rerun on the whole release (19 October): all 5,520 recordings with ECG II and BIS EEG; with the adopted model (model3), 36,928 good burst windows in the 2,710 recordings with at least 5.
Method
physiosync's stamp_clock takes each record's stamp minus the time given by the sample count. It estimates one rate per recording from whole teeth (the drift each correction removes, divided by the time since the last), then one offset per stretch between real gaps; corrected_times places every sample on that line. VitalDB rules: SNUADC corrects downwards and BIS upwards, and steps the other way are gaps; a SNUADC track in frequent-correction mode keeps its stamps; a step-mode track without a whole tooth takes its port's typical rate (−47 to −74 ppm); a BIS track without one takes its unit's mean rate. Since 17 October the 17.7 ms lost at each SNUADC step-mode correction is added back (Paced ECG as an independent clock).
Results
- Whole teeth on 151 SNUADC and 184 BIS tracks of 191; the rates agree with the correction scan where that is plausible.
- Within-case SD of the EEG–ECG offset: 137 ms on the recorded stamps, 25 ms on the model (median); the bursts' own noise floor is about 11 ms. Ramps flatten (median slope 53 → 12 ms/h) and lag jumps fall from 1.5 to 0.38 per case.
- A constant offset is left: EEG minus ECG −803 ms in step mode (117 cases) and −690 ms in frequent-correction mode (29 cases), tight within a port or unit.
| Correction | Median error | p90 |
|---|---|---|
| Recorded stamps | 792 ms | 1,005 ms |
| Stamps minus one constant | 126 ms | 259 ms |
| Model minus one constant | 38 ms | 154 ms |
| Model minus the SNUADC mode's constant (leave-one-out; no artefact needed) | 33 ms | 116 ms |
| Model minus the case's own constant from its bursts | 16 ms | 67 ms |
| Whole release (19 October). The model's ECG–EEG burst check, rerun on every recording | ||
(tools/burst_validation_agg.py): |
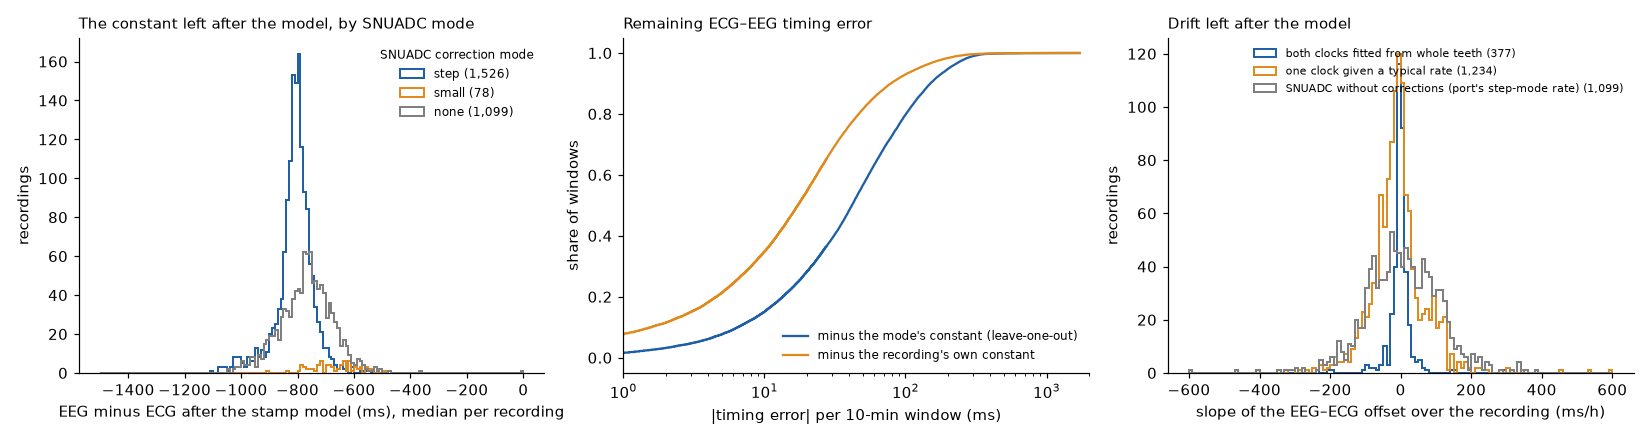
- The constants hold: EEG minus ECG −804.5 ms in step mode (1,530 recordings; interquartile range −835 to −776) and −667.5 ms in frequent-correction mode (78), against −803 and −690 ms on the benchmark.
- Where both clocks have whole teeth (377 recordings) the result matches the benchmark: within-recording SD 18 ms, drift left 8.7 ms/h (median absolute slope). Against the step-mode constant, a typical window is off by 35 ms (median; p90 135 ms).
- Recordings with no SNUADC correction at all (1,099) were the weak spot. The first model read them as frequent-correction mode and gave the SNUADC no drift, but their EEG–ECG offset drifted by a median of −176 ms/h, the step-mode drift: these are step-mode recordings that end before the first reset.
- Giving them their port's step-mode rate fixes most of it (model2, rerun on every recording,
tools/sa_corrected.py). For these 1,096 recordings:
| Drift assumed 0 | Port's step-mode rate | |
|---|---|---|
| Within-recording SD (median) | 62 ms | 25 ms |
| Drift left (median slope) | −176 ms/h | −11 ms/h |
| Drift left (median absolute slope) | 183 ms/h | 74 ms/h |
| Error against the mode's constant (median; p90) | 81; 208 ms | 63; 177 ms |
What is left is spread both ways (p10–p90 −135 to +122 ms/h): each recording's SNUADC drifts at its own rate, not its port's median. - The same for the BIS (model3). A BIS that makes no correction also got zero drift. Giving it its port's median BIS rate against the recorder PC (+16 to +50 ppm by port, from the correction steps of the full release, never from the bursts) fixes the 236 recordings where that happens:
| BIS with no correction | Recordings | Drift left (median), model2 → model3 | Within-recording SD |
|---|---|---|---|
| Shorter than the 8,192 s BIS timer | 202 | −92 → −16 ms/h | 21 → 17 ms |
| Longer | 34 | −66 → −14 ms/h | 32 → 28 ms |
Over all recordings the gain is small (within-recording SD 23.9 → 23.4 ms; median absolute slope 42.6 → 40.3 ms/h), because few recordings are affected. - Over all 2,707 recordings with model2: a median error of 42 ms against the mode's constant and 18 ms against the recording's own constant (p90 151 and 79 ms); within-recording SD 24 ms (first model: 46, 22, 165, 106 and 34 ms). - The adopted model (model3), over all 2,710 recordings with at least 5 good windows: EEG minus ECG −804 ms in step mode (1,526 recordings; interquartile range −833 to −776), −660 ms in frequent-correction mode (78), and −766 ms with no SNUADC correction (1,099). A median error of 42 ms against the mode's constant (p90 150 ms) and 17 ms against the recording's own constant (p90 79 ms); within-recording SD 23 ms. These are the values in EEG–ECG constant after the stamp model and EEG–ECG timing error after the stamp model. (The first bullet above is the first model, before the recordings with no correction were given a rate.)
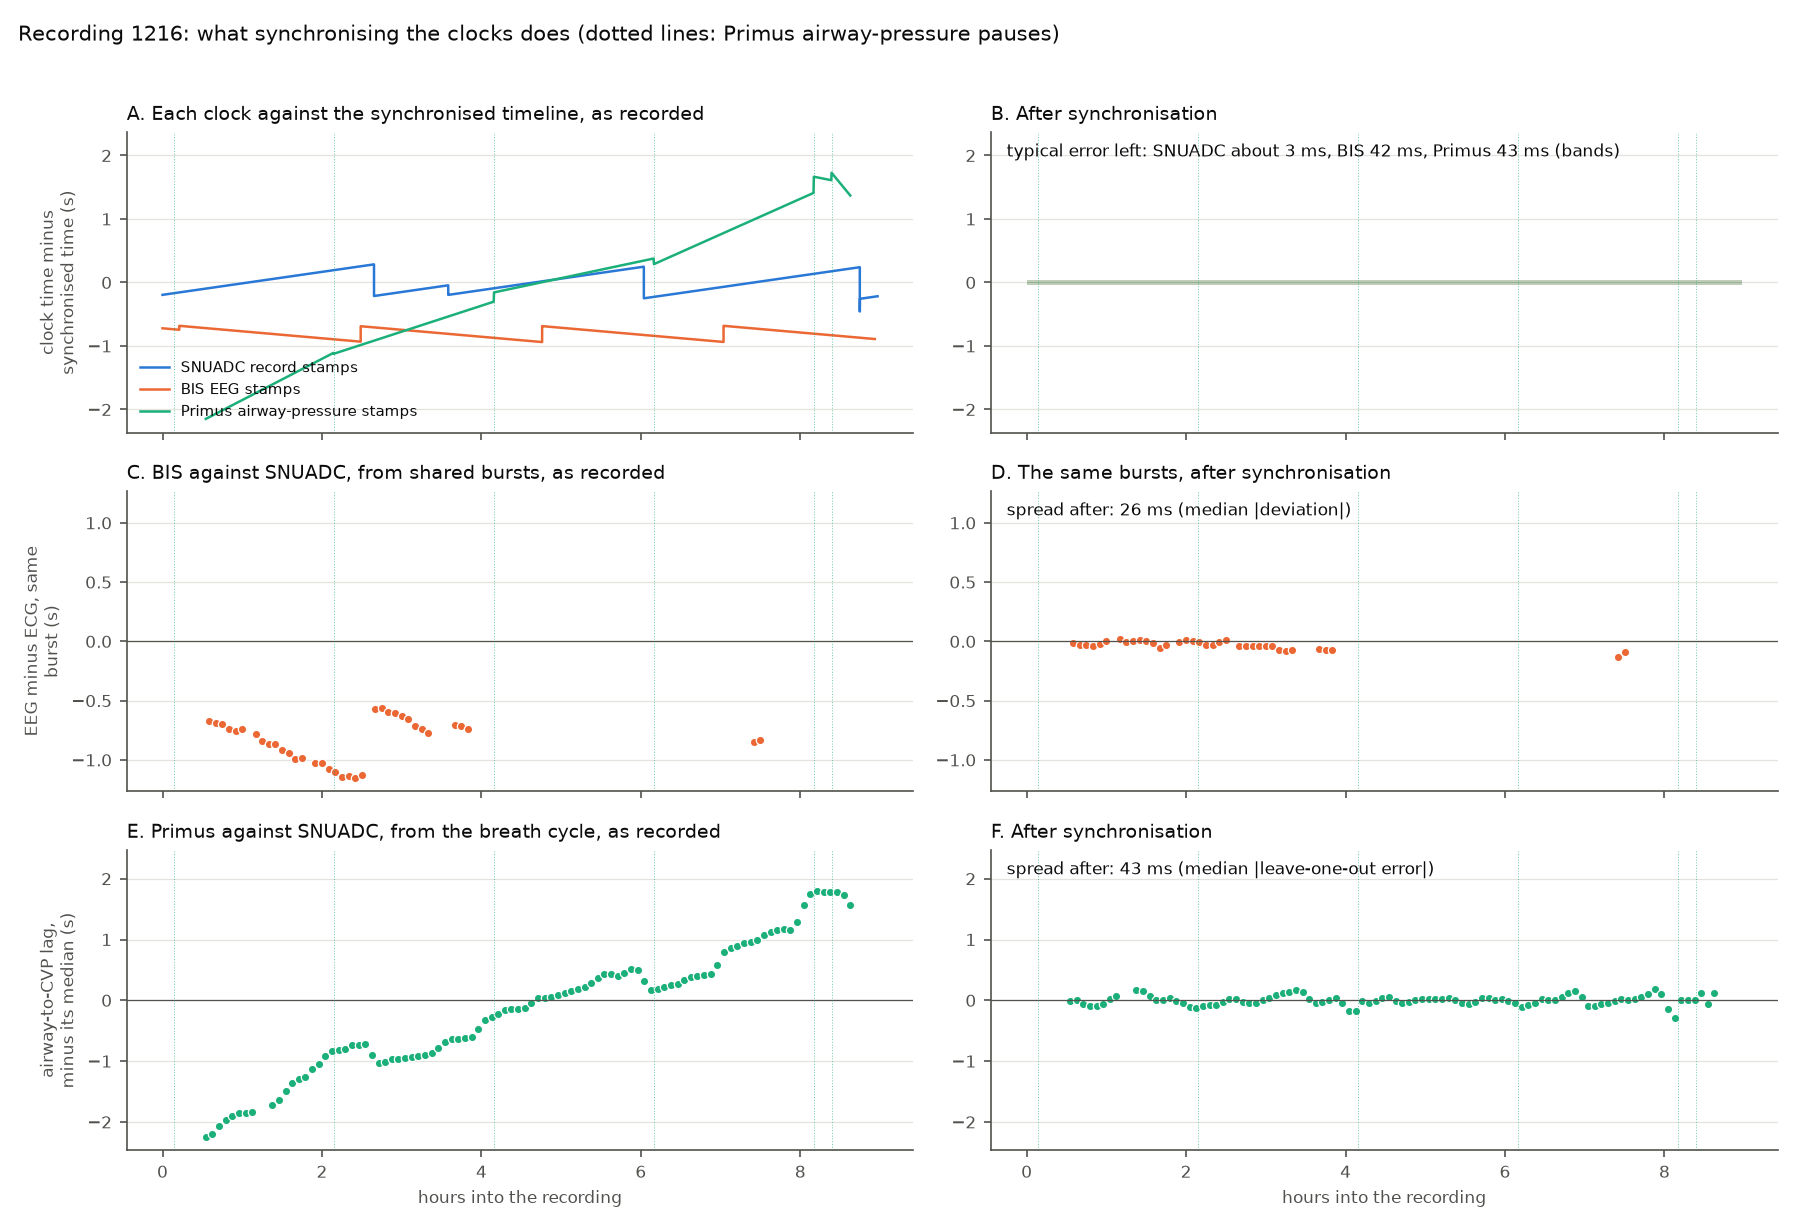
What this looks like in one recording, together with the Primus:
| Parameter | Value | Status | From |
|---|---|---|---|
| BIS drift against the recorder PC | 25 ppm (p10–p90 12 to 50; 5th–95th 7.3–51.1 ppm; census fit of 4,728 recordings median 21.1 ppm) | measured | The stamp sawtooth model for SNUADC and BIS |
| SNUADC step-mode drift | −63 ppm (p10–p90 −79 to −44; 5th–95th −80.3 to −36.9 ppm; medians of −46 to −74 ppm by serial port) | measured | The stamp sawtooth model for SNUADC and BIS |
| EEG–ECG constant after the stamp model | −804 ms in step mode (1,526 recordings); −660 ms in frequent-correction mode (78) | measured | The stamp sawtooth model for SNUADC and BIS |
| SNUADC step-mode correction interval | 2.08 h (5th–95th 1.65–3.57 h between resets; per-recording means p10–p90 1.68–3.07 h) | measured | The stamp sawtooth model for SNUADC and BIS |
| EEG–ECG timing error after the stamp model | 42 ms median, p90 150 ms (17 ms and 79 ms with the recording's own bursts) | measured | The stamp sawtooth model for SNUADC and BIS |
Discussion
The model needs no artefact; the bursts only check it and supply the constant. With the constant for the case's SNUADC mode, a typical window lines up to about 42 ms over the whole release (33 ms in the pilot); with the recording's own bursts, to about 17 ms. These are the numbers behind the BIS EEG "after sync" timing in the planner.
Observations it supports
| Observation | Status | Summary |
|---|---|---|
| About 20 ms of signal lost at every SNUADC reset | established | At each step-mode reset the acquisition pauses for about 20 ms inside the last record before the new timing, and that time is never sampled: 17.7 ms on the sample count (Signal lost at a SNUADC step-mode correction), once the filler sample is counted. Every record still holds 100 samples, so nothing in the file shows it. |
| SNUADC sends no time; the recorder stamps by count | established | The SNUADC board streams samples with no time stamps. Every SNUADC time in VitalDB is the recorder's model of the board's clock: the sample count at the nominal rate, pulled back when it drifts too far. |
| The EEG–ECG offset is fixed by the SNUADC correction mode | established | After the stamp model, BIS EEG still lags the SNUADC ECG by a constant: −804 ms in step mode and −660 ms in frequent-correction mode over the whole release, tight within a port or unit. The mode, a property of the setup, sets the constant. |
Limitations
Recordings that change correction mode partway, or have many gaps, still fail (p99 about 250 ms). The error distributions come from the bursts, so they include the probe's own noise.
Open questions
- Recordings without a SNUADC correction (next step). Giving the 1,096 recordings without a SNUADC correction their port's step-mode rate removed most of their drift (median −176 to −11 ms/h), but each still drifts at its own rate (p10–p90 −135 to +122 ms/h left). A per-recording rate cannot come from the stamps: with no correction they carry no information about the recorder PC (the census gives −1.0 ppm, the stamp arithmetic, for all of them). It needs a clock tied to the PC that shares events with the SNUADC (bursts against a BIS with whole teeth, in 122 recordings; calibration, so tested on held-out windows), or the setup's unit. Where the BIS has teeth the bursts imply the SNUADC drifts about −36 ppm rather than −63, the fast-BIS, slow-SNUADC pattern of When each device's clock is corrected, in every recording's open question.
- Recordings that change correction mode partway (unexplained phenomenon). Recordings that change correction mode partway still fail the model (p99 about 250 ms). Why a recording changes mode, and how to fit both parts, is open.
- Why the constant offset differs between modes (unexplained phenomenon). The EEG lags the ECG by −0.80 s in step mode and −0.66 s in frequent mode after the model (whole release; −0.69 s in the pilot); why the constant differs between modes is not known.
Worked examples
| Example | Side | Status | Summary |
|---|---|---|---|
| Pulse pressure variation gated by ventilator breaths | time | draft | Pulse pressure variation per ventilator breath, in 3,448 recordings: the ventilator's clock sits a median 1.8 s off the arterial line's, which moves half of all breaths' values by a point or more and scatters where in the breath the pulse pressure peaks; a recording's median PPV hardly changes. |
Code
Figures