Draft
Worked through on a few cases; numbers may change.
Urine output in mL/kg/h as a distribution
Intraoperative urine output per kilogram per hour, from three rounded inputs, as a probability distribution per case: one case in ten cannot be placed confidently on either side of 0.5 mL/kg/h.
The question
Was this patient's urine output below 0.5 mL/kg/h during the operation?
Inputs
Each input links to its measurement page: how it is timed, how its value was recorded, and how uncertain both are.
| Input | Unit | What it is |
|---|---|---|
| Intraoperative urine output | mL | Intraoperative urine output (clinical table). |
| Weight | kg | Weight (clinical table). |
| Anaesthesia duration | min | Anaesthesia duration (derived table). |
Why the atlas changes the answer
The answer is a ratio of three recorded numbers, each rounded in its own way: urine output heaped on 50 and 100 mL (Rounding and heaping of intraoperative urine output), weight on whole kilograms or a scale's 0.1 or 0.05 kg (Rounding and heaping of weight), and the anaesthesia start and end on 5- and 10-minute marks (Bias in charted intervals). Computed from the recorded numbers, the rate is one number; the true rate can lie on either side of a threshold.
Data
The 3,645 cases with a positive urine output, a weight and both anaesthesia times (39 more with a positive urine output lack one of the others or have no distribution for it). Recorded zeros are left out until the zero rule is in the library.
Steps
- For each case, draw 4,000 true values of urine output, weight and anaesthesia duration from the pinned
vitaldb-resolution library (v0.6.0, model version 2: urine output conditioned on the case's anaesthesia
duration and department;
Registry.case_distribution). - Form urine output / weight / duration in hours for each draw.
- Summarise each case by its median, a 95% interval and P(rate < 0.5 mL/kg/h); class it as confidently below (P > 0.95), confidently above (P < 0.05) or uncertain.
- Compare with the single rate computed from the recorded numbers.
Results
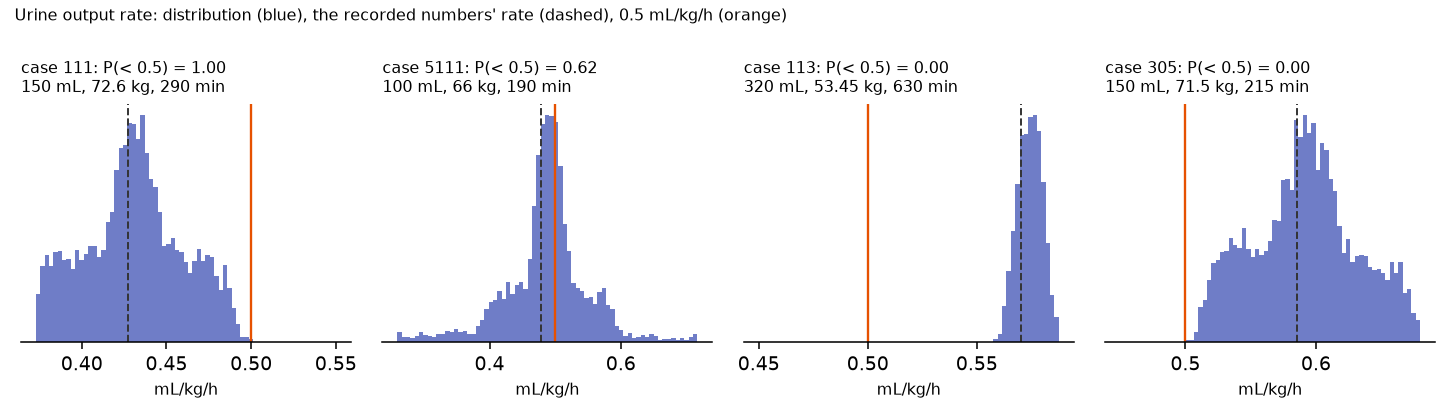
Four cases. The distributions differ in width as much as in position. case 5111 (100 mL, 66 kg, 190 min) sits on the threshold with a wide distribution, because a recorded 100 mL may be anything from about 50 to 150 mL: P(below 0.5) = 0.62, 95% interval 0.32 to 0.63 mL/kg/h. case 111 is close to the threshold but confidently below; case 113, with 320 mL (written to the nearest 10), is narrow and confidently above.
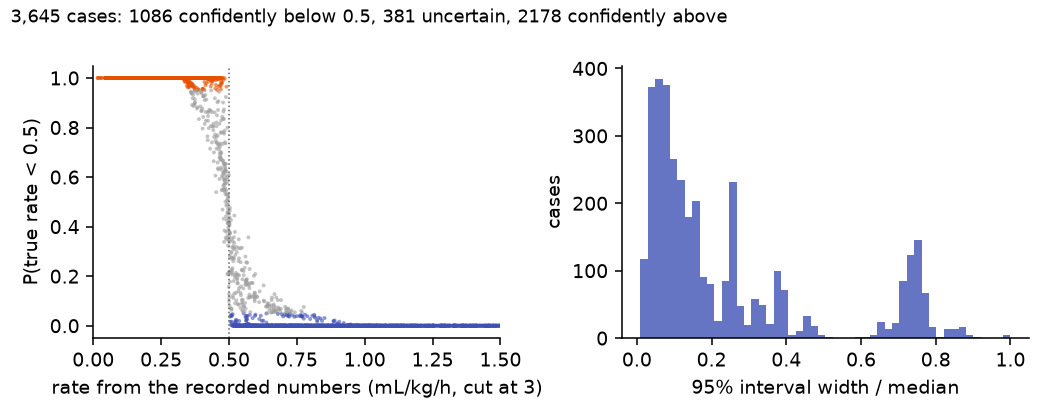
The cohort. Of 3,645 cases, 1,086 are confidently below 0.5 mL/kg/h, 2,178 confidently above, and 381 (10%) uncertain. Nearly all the uncertain ones (365) have a recorded rate between 0.35 and 0.7, where they are a third of the cases. Of the 1,276 cases the recorded numbers put below 0.5, 190 are not confidently below; of those they put above, 191 are not confidently above. The 95% interval is 14% of the rate in the median case (4% to 73%, 10th to 90th percentile); the widest are cases with a round urine output of 50 or 100 mL.
Population and individual
Random: cancels over a cohort.
| The cohort | The rounding adds spread but almost no bias: the median of the distributions sits within a hair of the recorded rate. |
| Each patient | 381 of 3,645 patients (10%) cannot be placed confidently on either side of 0.5 mL/kg/h; with a round 50 or 100 mL, many more. |
Takeaways
- A threshold on a derived rate misclassifies cases near it in a way the recorded numbers cannot show. Report the share that is uncertain, or carry P(below) into the analysis instead of a yes or no.
- Most of the uncertainty comes from urine output recorded as a round 50 or 100 mL; weight and duration add little.
Limitations
- The three inputs are drawn independently; the duration's two ends share the anaesthesia record's clock.
- Recorded zeros (23 cases) are left out; the library's zero rule (v0.6.0) gives them a point mass and a flag, not a rate.
Studies it relies on
| Study | Date | Status | Summary |
|---|---|---|---|
| Rounding and heaping of intraoperative urine output | 2026-10-18 | current | Recorded intraoperative urine output is a mixture of 4 rounding modes (100 mL, 50 mL, 10 mL, 5 mL (base)); the model gives the true value's distribution for each record. |
| How the anesthesia start time was charted | 2026-10-18 | current | The charted anesthesia start time is a mixture of 5 ways of writing a clock time (nominal_0740, nominal_0730, nearest_10min, nearest_5min, clock_minute), modelled as an offset from a device time. |
| How the anesthesia end time was charted | 2026-10-18 | current | The charted anesthesia end time is a mixture of 4 ways of writing a clock time (ceiling_30min, ceiling_10min, ceiling_5min, clock_minute), modelled as an offset from a device time. |
| Rounding and heaping of weight | 2026-10-13 | current | Recorded weight is a mixture of 3 rounding modes (whole_kg, scale_0.1, scale_0.05); the model gives the true value's distribution for each record. |
| Bias in charted intervals | 2026-10-13 | current | Charted intervals are biased because each end is rounded with a different anchor, and their per-case uncertainty is large relative to short intervals. |
Reproduce it
python examples/urine_output_rate.py --resolution <vitaldb-resolution at the pinned commit> \
    --root <VitalDB release> --out out/uo --figure 5111 111 113 305