Draft
Worked through on a few cases; numbers may change.
A regression that carries rounding uncertainty through
Acute kidney injury after surgery against intraoperative urine output (mL/kg/h), fitted once on the recorded numbers and once per draw from the true-value distributions: the rounding moves 14% of cases across the oliguria threshold, but widens the confidence interval of the cohort's regression by at most 4%.
The question
Is lower intraoperative urine output associated with acute kidney injury after surgery, and how much of the uncertainty in the answer comes from the rounding of the inputs?
Inputs
Each input links to its measurement page: how it is timed, how its value was recorded, and how uncertain both are.
| Input | Unit | What it is |
|---|---|---|
| Intraoperative urine output | mL | Intraoperative urine output (clinical table). |
| Weight | kg | Weight (clinical table). |
| Anaesthesia duration | min | Anaesthesia duration (derived table). |
| Preoperative creatinine | mg/dL | Preoperative creatinine (clinical table). |
| Creatinine | mg/dL | Creatinine (lab table). |
Why the atlas changes the answer
The exposure is a ratio of three rounded numbers (Urine output in mL/kg/h as a distribution): urine output heaped on 50 and 100 mL, weight, and anaesthesia times on 5- and 10-minute marks. Rounded inputs act like measurement error (Carroll et al. 2006): they can flatten a slope (regression dilution), and an interval computed from the recorded numbers leaves their uncertainty out. Fitting the model once per draw from the true-value distributions and combining the fits by Rubin's rules, as in multiple imputation (Rubin 1987), carries it through.
Data
The 3,042 cases with a positive urine output, a weight, both anaesthesia times, a preoperative creatinine and at least one creatinine in the 48 hours after the end of surgery. 225 (7.4%) have acute kidney injury by the KDIGO creatinine criterion (Kidney 2012): the highest postoperative creatinine at least 0.3 mg/dL above the preoperative value, or at least 1.5 times it. Postoperative creatinine is reported to 0.01 mg/dL and is used as recorded.
Steps
- For each case, draw 200 true values of urine output, weight, anaesthesia duration and preoperative creatinine from the pinned vitaldb-resolution library (v0.6.0), and form the urine output rate for each draw.
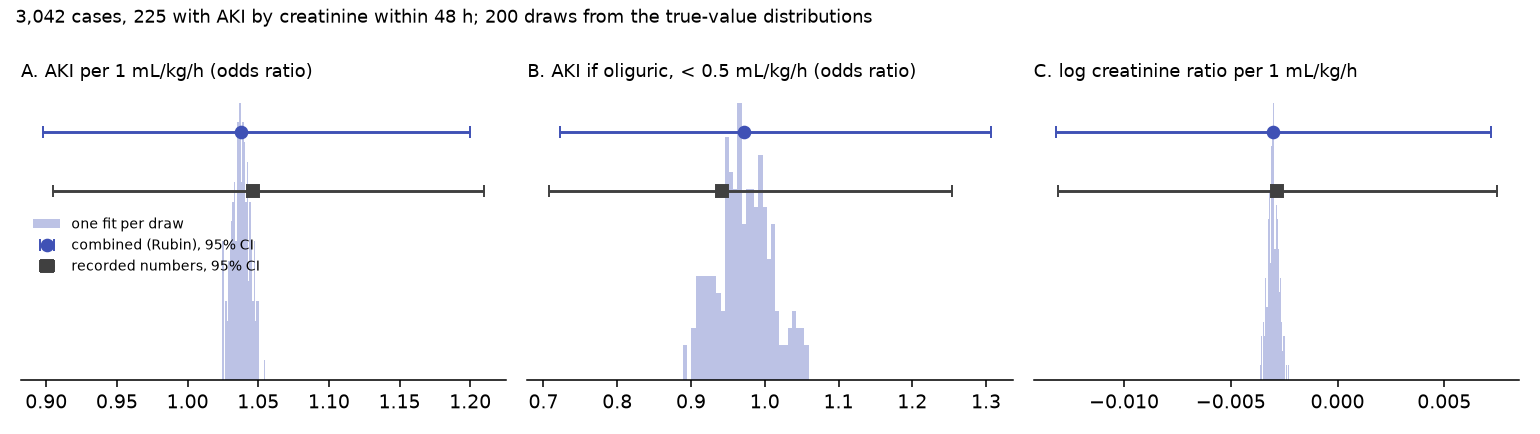
- Fit three unadjusted models on the recorded numbers (naive): A. logistic, kidney injury against the rate (per 1 mL/kg/h, capped at 5); B. logistic, kidney injury against oliguria (rate below 0.5 mL/kg/h); C. linear, log of the highest postoperative over the preoperative creatinine against the rate.
- Fit the same three models once per draw (kidney injury recomputed with that draw's preoperative creatinine), and combine the 200 fits by Rubin's rules: the estimate is their mean, and the variance adds the spread between draws to the mean within-fit variance.
- Compare: the estimate, the 95% interval, and the share of the total variance that comes from the rounding (the between-draw part).
Results
No association, either way. The models are unadjusted, so the clinical answer is not the point; it is the same with and without the rounding:
| Model | Recorded numbers | Carried through (200 draws) | Share of variance from rounding |
|---|---|---|---|
| A. Odds ratio per 1 mL/kg/h | 1.05 (0.91 to 1.21) | 1.04 (0.90 to 1.20) | 0.7% |
| B. Odds ratio if oliguric | 0.94 (0.71 to 1.25) | 0.97 (0.72 to 1.31) | 6.3% |
| C. Log creatinine ratio per 1 mL/kg/h | −0.003 (−0.013 to 0.008) | −0.003 (−0.013 to 0.007) | 0.2% |
Where the rounding shows. In 413 of the 3,042 cases (14%) the draws put the rate on both sides of 0.5 mL/kg/h, so oliguria is not a fixed property of those cases. That is what widens model B's interval (by 4%) and moves its estimate. With the rate as a number (A and C), each case's uncertainty is small next to the spread of rates between cases, and the rounding adds almost nothing. The fit on the recorded numbers in model A lies at the edge of the fits on the draws: rounding shifts it slightly, though far less than its confidence interval. Kidney injury itself changes with the preoperative creatinine's rounding in only 7 cases.
Does the threshold matter? Moving the oliguria threshold from 0.2 to 1.5 mL/kg/h changes how many cases cross it between draws (6% to 14%), but never gives the rounding more than a small share of a cohort's uncertainty:
| Threshold (mL/kg/h) | Oliguric (recorded) | Cases crossing between draws | Rounding's share of the variance: prevalence | Rounding's share of the variance: odds ratio |
|---|---|---|---|---|
| 0.2 | 7.2% | 8% | 11% | 5% |
| 0.3 | 15.9% | 12% | 11% | 8% |
| 0.5 | 35.5% | 14% | 8% | 6% |
| 0.75 | 55.1% | 12% | 5% | 5% |
| 1.0 | 67.7% | 10% | 5% | 5% |
| 1.5 | 83.1% | 6% | 4% | 4% |
Nor do the subgroups where the rounding is worst: among cases with a round 50 or 100 mL (200 mL or less), 42% cross 0.5 between draws, yet the rounding is still only 18% of the variance of their prevalence. Each case's error is independent and nearly symmetric, so over hundreds of cases it cancels; for one case it does not (Oliguria labels for a prediction model).
Population and individual
Random: cancels over a cohort.
| The cohort | Carried through 200 draws, the rounding is under 8% of the variance at any threshold: the cohort's answer does not change. |
| Each patient | 14% of patients sit on both sides of 0.5 mL/kg/h between draws, which is what the cohort averages over. |
Takeaways
- Carry rounding through a regression by fitting once per draw and combining with Rubin's rules; the fraction of the variance that comes from the draws says how much the rounding matters for that question.
- A threshold is where rounding matters most: dichotomising the exposure (oliguria) gave rounding ten times the weight it has with the rate as a number.
- For a cohort-level question VitalDB's rounding is small next to the spread between patients, whatever the threshold, because independent errors cancel; only a systematic error would not. For a label or decision per patient it matters (Oliguria labels for a prediction model, Urine output in mL/kg/h as a distribution).
Limitations
- The draws come from the distribution of the true value given the recorded one, without using the outcome. For measurement-error correction the imputation should also condition on the outcome (Cole et al. 2006); without it the combined slope is pulled slightly towards zero. Here the rounding is small enough that this hardly matters.
- Unadjusted models, and creatinine-based kidney injury only (no urine criterion, no baseline other than the preoperative value). The clinical question needs adjustment for case mix.
- The inputs are drawn independently; the duration's two ends share the anaesthesia record's clock.
Studies it relies on
| Study | Date | Status | Summary |
|---|---|---|---|
| Rounding and heaping of intraoperative urine output | 2026-10-18 | current | Recorded intraoperative urine output is a mixture of 4 rounding modes (100 mL, 50 mL, 10 mL, 5 mL (base)); the model gives the true value's distribution for each record. |
| How the anesthesia start time was charted | 2026-10-18 | current | The charted anesthesia start time is a mixture of 5 ways of writing a clock time (nominal_0740, nominal_0730, nearest_10min, nearest_5min, clock_minute), modelled as an offset from a device time. |
| How the anesthesia end time was charted | 2026-10-18 | current | The charted anesthesia end time is a mixture of 4 ways of writing a clock time (ceiling_30min, ceiling_10min, ceiling_5min, clock_minute), modelled as an offset from a device time. |
| Rounding and heaping of weight | 2026-10-13 | current | Recorded weight is a mixture of 3 rounding modes (whole_kg, scale_0.1, scale_0.05); the model gives the true value's distribution for each record. |
| Bias in charted intervals | 2026-10-13 | current | Charted intervals are biased because each end is rounded with a different anchor, and their per-case uncertainty is large relative to short intervals. |
| Package validation and Monte Carlo cache | 2026-10-13 | current | The vitaldb_resolution package returns a status for every value in the dataset, reproduces each fitted likelihood, and can precompute every posterior for fast Monte Carlo draws. |
Reproduce it
python examples/regression_with_rounding.py --resolution <vitaldb-resolution at the pinned commit> \
    --root <VitalDB release> --out out/regression --draws 200